Excel Hücrelerini Metne Sığdırma: 4 Kolay Çözüm

Excel hücrelerini metne sığdırmak için güncel bilgileri ve 4 kolay çözümü keşfedin.
In this tutorial, you’ll learn about creating a bar chart visualization using Charticulator. Bar charts are one of the most common visuals in a data report.
The advantage of creating bar charts using Charticulator is that you can highlight project leads to make them standout. It also doesn’t change the position of the axes when selecting a different filter context.
Table of Contents
Creating A Bar Chart Visualization
This is a sample report with three different bar charts.
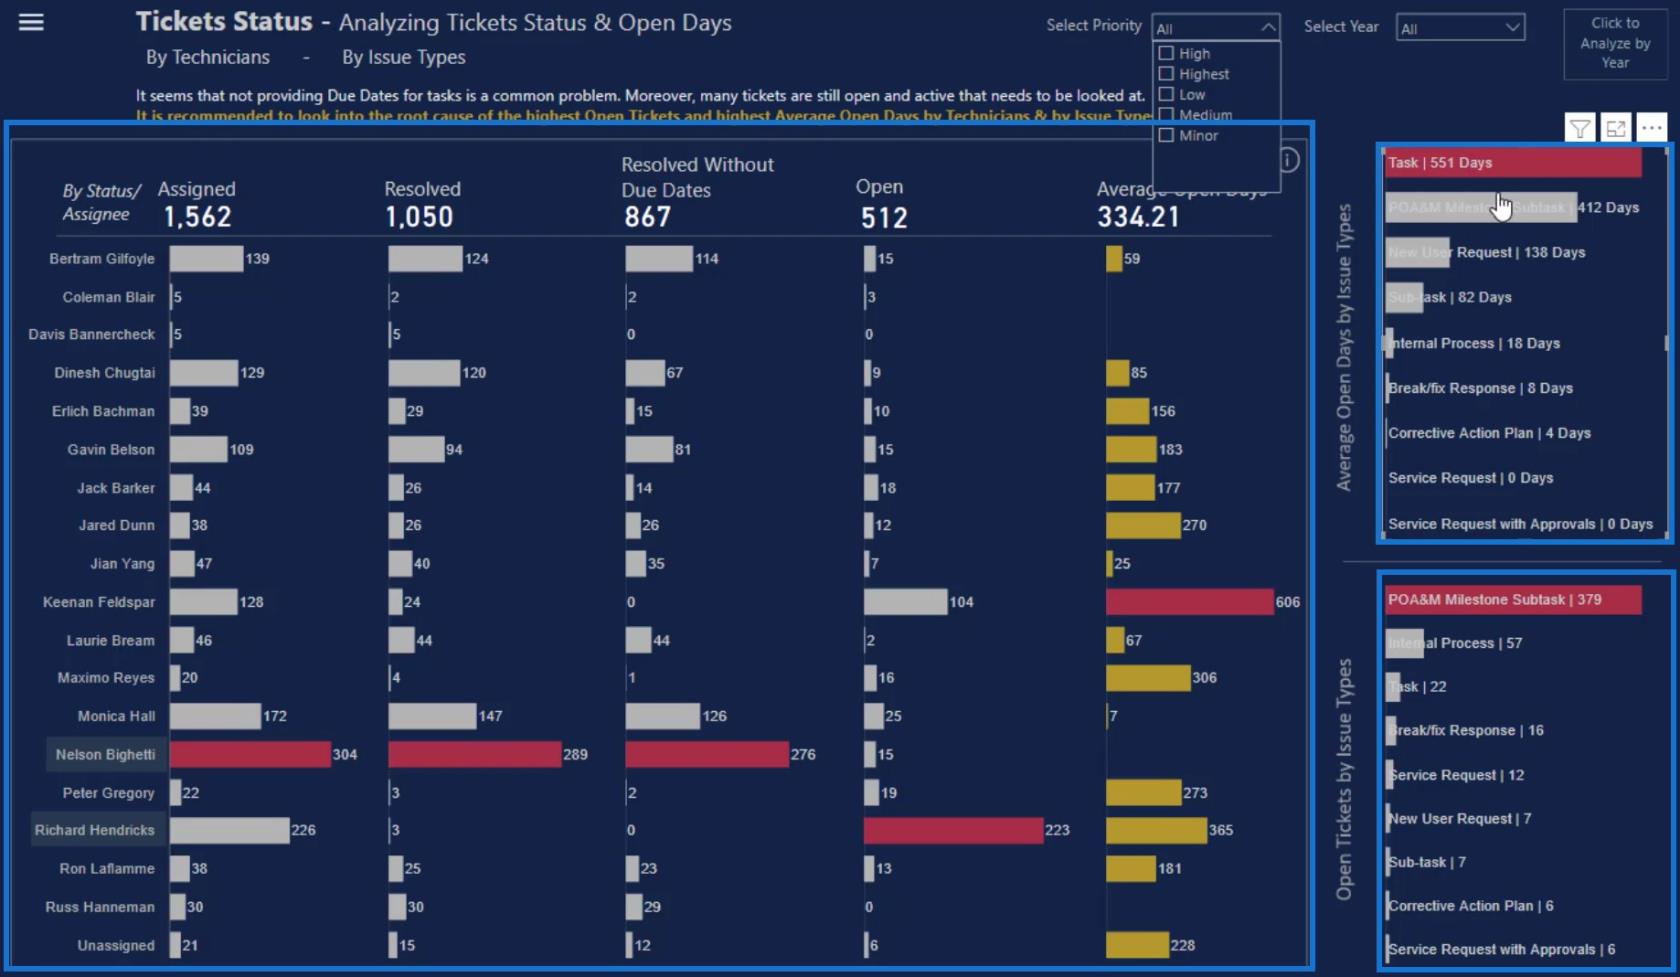
The two small bar charts on the left side of the canvas are different from the big chart in the middle because they both have the category and values inside the bar.
Create And Export A Dataset
To recreate these small bar charts, you’ll need these three things in the Charticulator: the Assignee, Count of Tickets, and Max Tickets Count By Assignee.
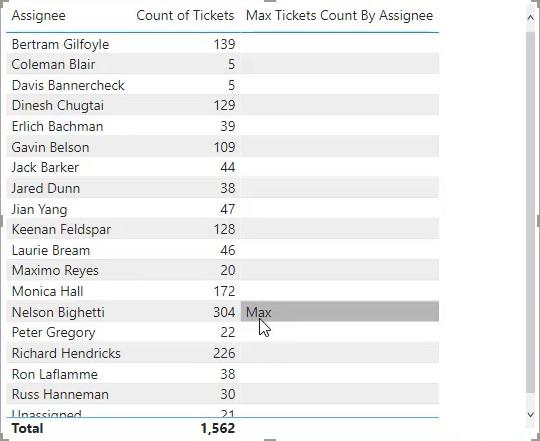
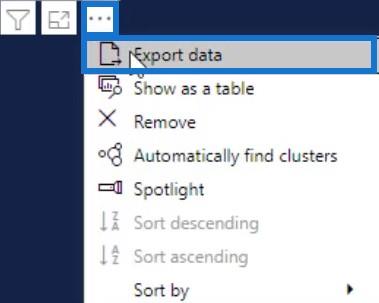
Once you have these components, click the three dots below the table and select Export data. Make sure to save the data as a CSV file type.
Next, go to charticulator.com and click Launch Charticulator.

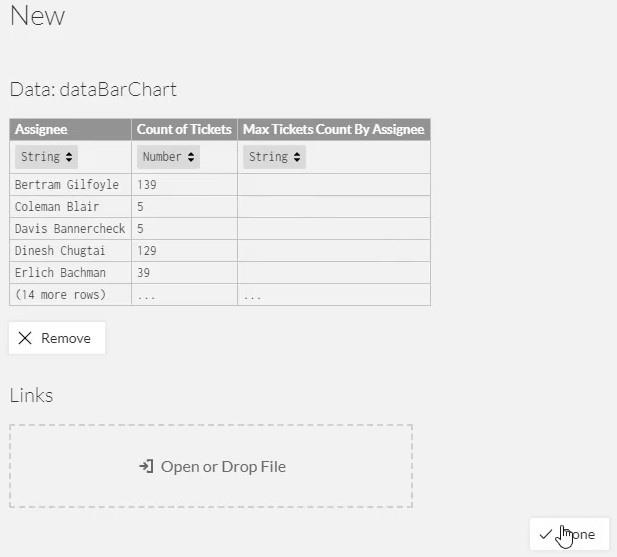
Open the exported dataset and click Done. It will then bring you to the Charticulator canvas.
Set Up The Bar Chart Visualization
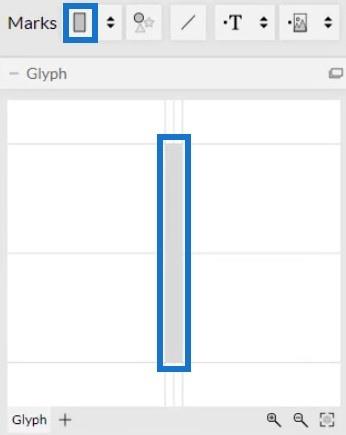
Drag the rectangle shape from the Marks setting to the Glyph canvas. The shape will automatically form in the actual canvas.
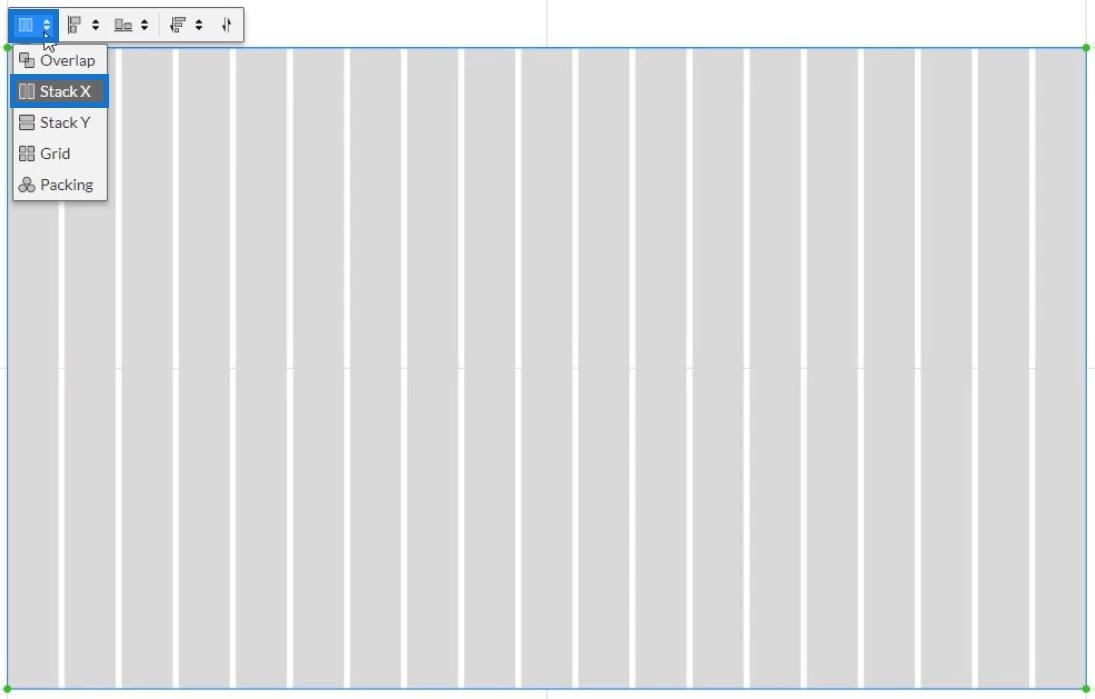
Next, click inside the canvas and select Stack Y to change the position of the bar.
After that, drag Assignee data to the Y-Axis of the canvas and adjust it to fit.
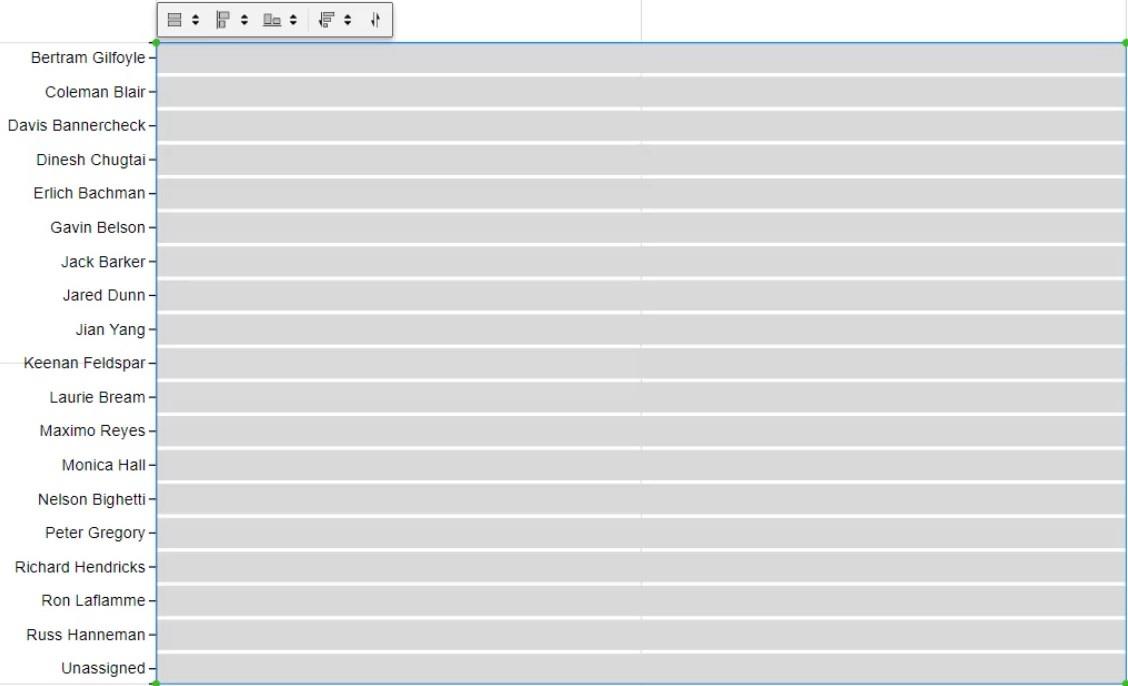
Place the values inside the bar by dragging Count of Tickets to the width of the Glyph.
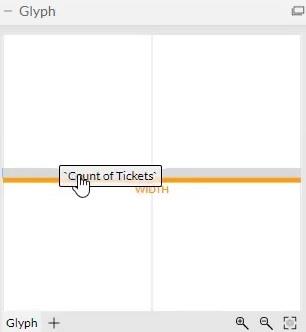
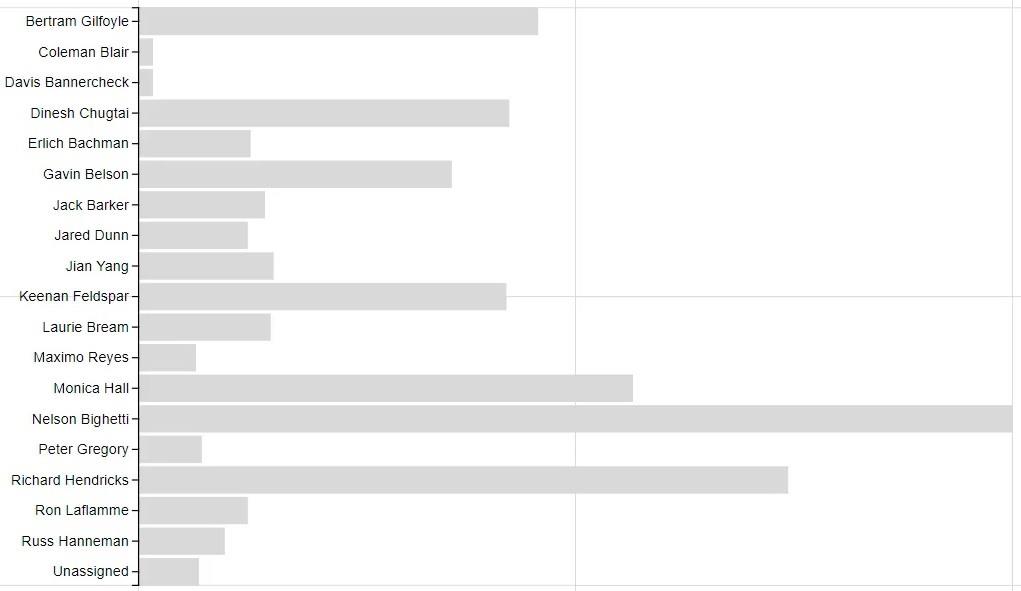
You can then see that the chart recognizes the values and changes the size of the bar.
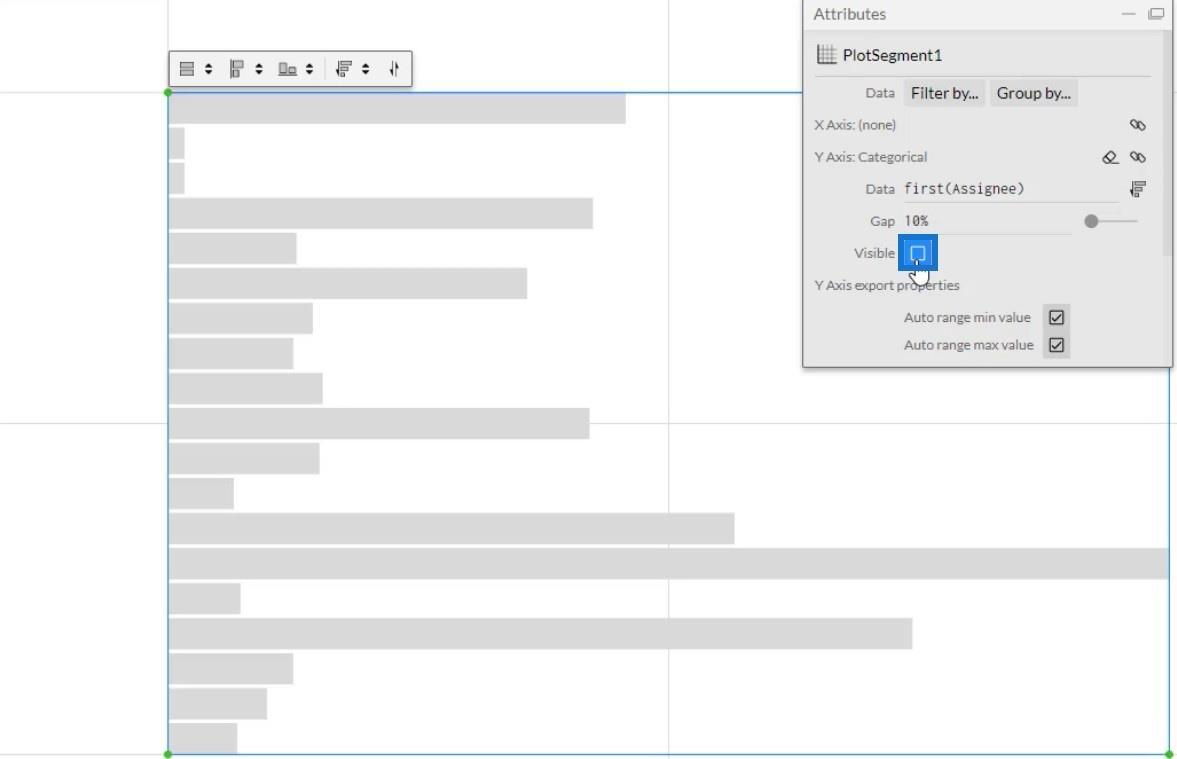
The next thing to do is place the categories and values inside the bars. Click PlotSegments1 to change the attributes of the chart. Next, uncheck the Visible box to hide the categories in the Y-Axis.
Now, drag and drop Text in the Glyph.
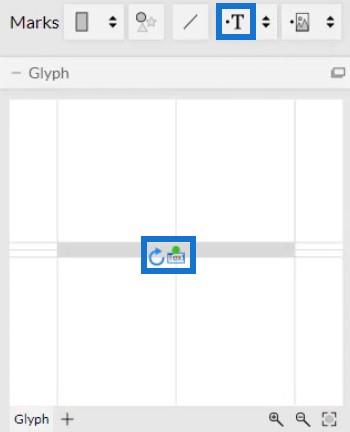
To align the Text, click on the circle and bring it to the edge of the shape. Then, adjust it by placing it inside the bar.
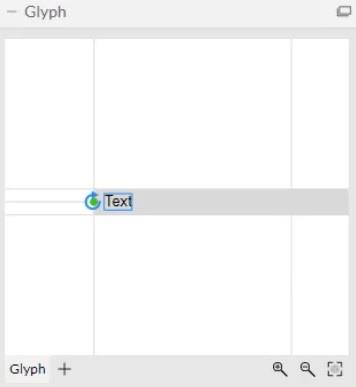
Your bar chart will then look like this. You may change the attributes of the texts and bars based on your own preference.
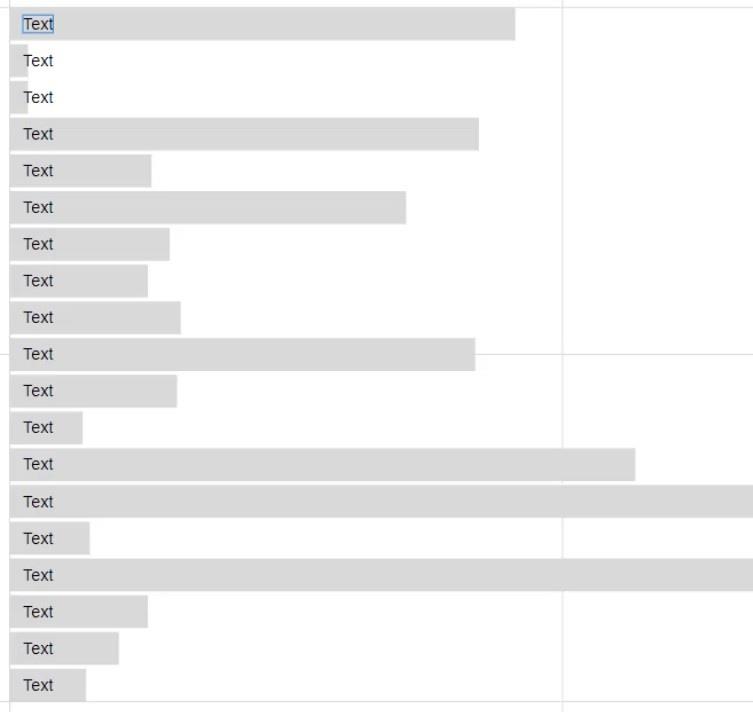
Establish The Data Labels And Values
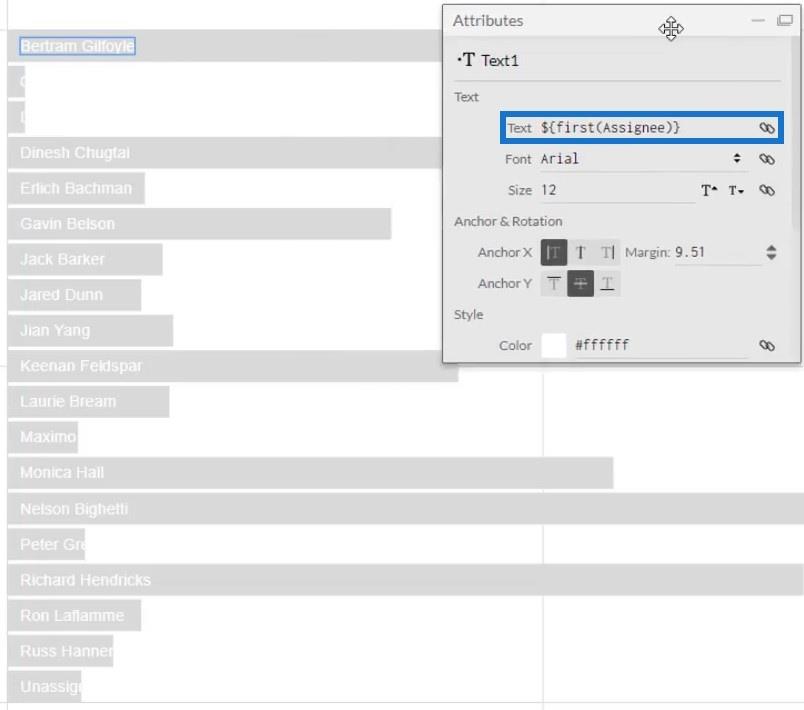
Now, place Assignee in the bar by dragging them into the Text section of Text1’s Attributes. You can then see all the categories inside the bars.
The next thing to do is put the values along the categories in the bars. Put another Text inside Glyph and place Count of Tickets in the Text section inside the Text section in Text2’s Attributes. Next, copy the code in the Text section.
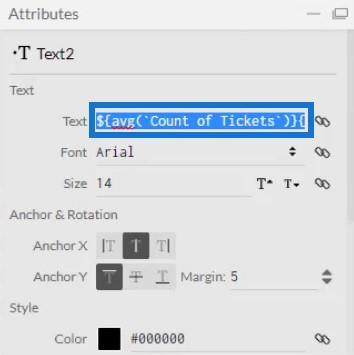
After copying it, delete Text2 and paste the code in the Text section of Text1’s Attributes. Make sure to separate the codes with a vertical bar. After that, you will see a vertical bar and a value after each category.
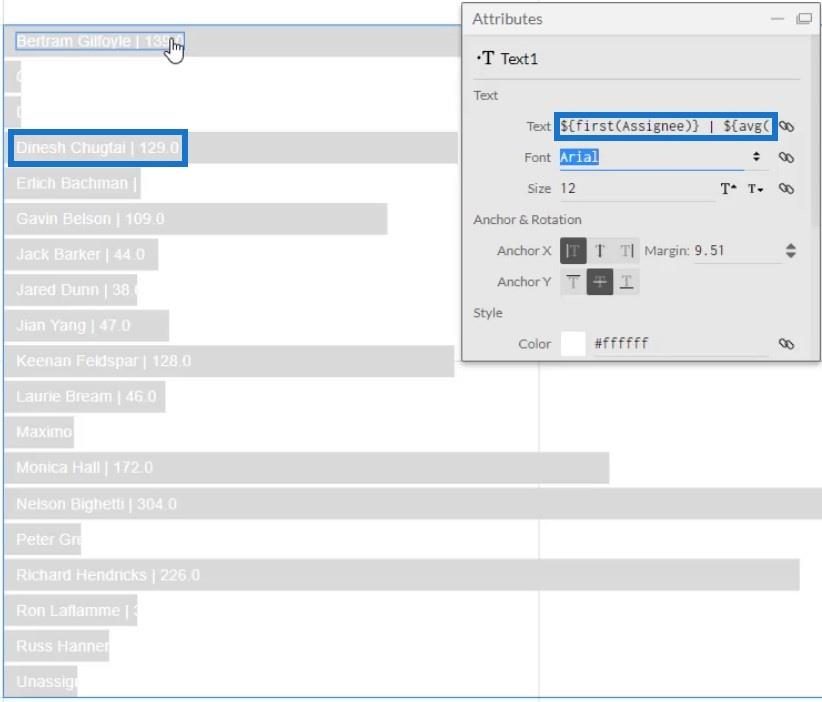
Finalize The Visualization Of The Bar Chart
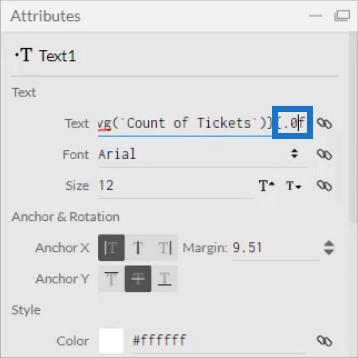
If you look at the values, you can see that it has decimals. Remove it by changing .1 to .0 in the code inside the Text section. After that, the values will now show whole numbers.
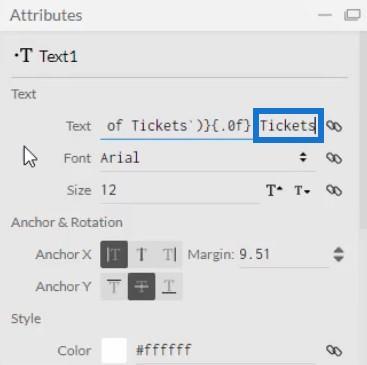
You may also add words after the code in the Text section to specify the unit of the values. For this example, Tickets is used.
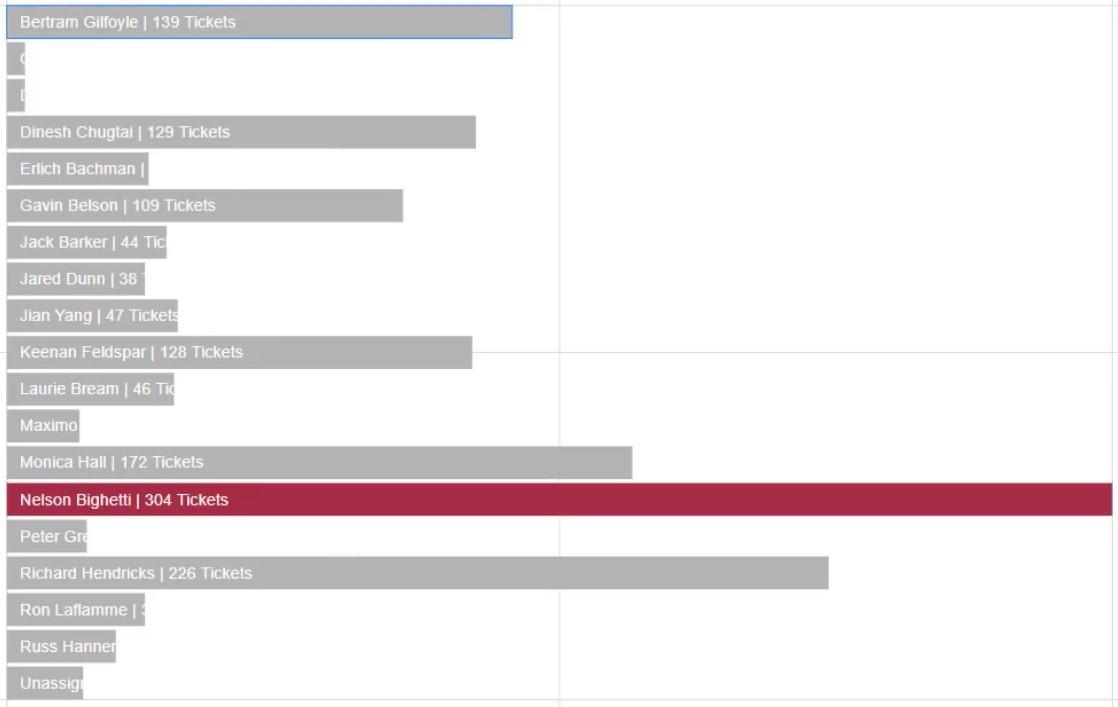
Now you need to highlight the bar with the maximum value. Click Shape1 to open its setting attributes, and drag Max Tickets Count By Assignee to the Fill Style.
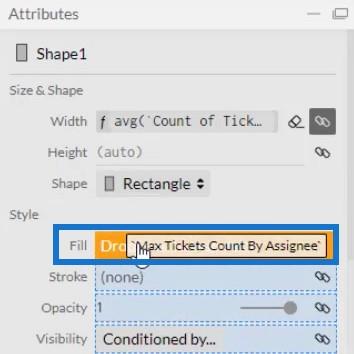
You can then see all the bars have the same color except for the category that has the most tickets. You can change the colors of the bars to your preference.
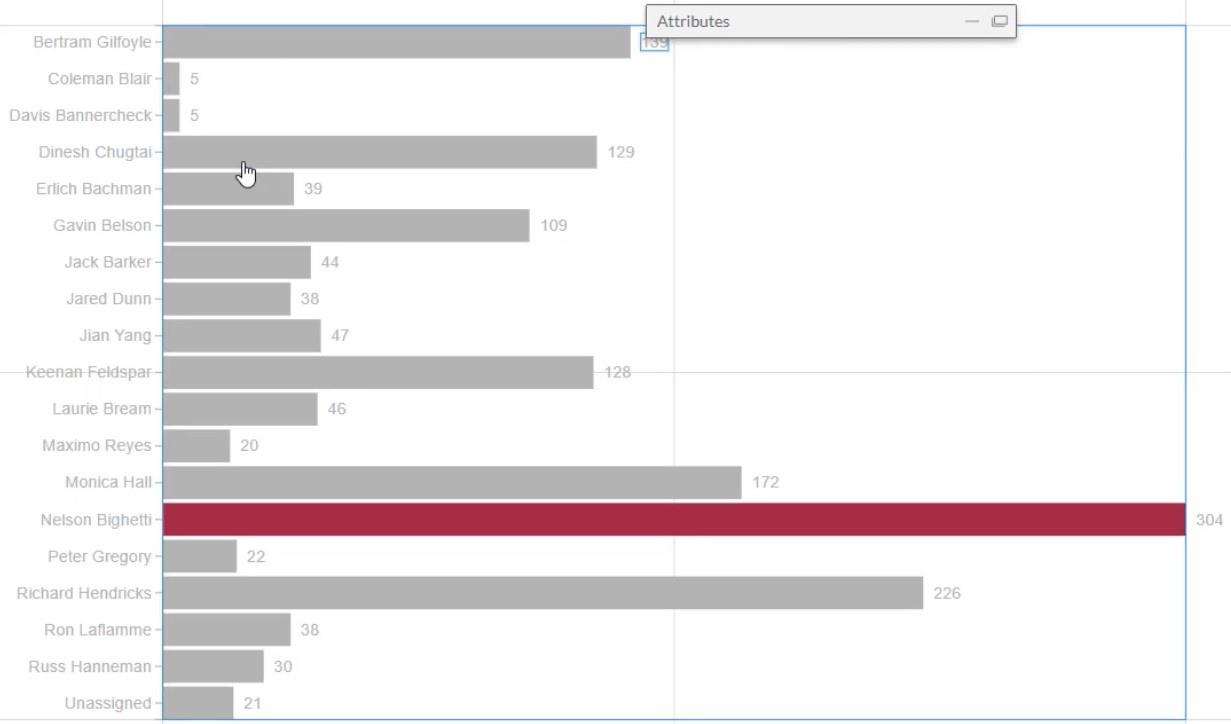
To recreate the big bar chart in the sample canvas, delete Text1 and make the categories in the Y-Axis visible again. Click PlotSegments1 and check the Visible box.
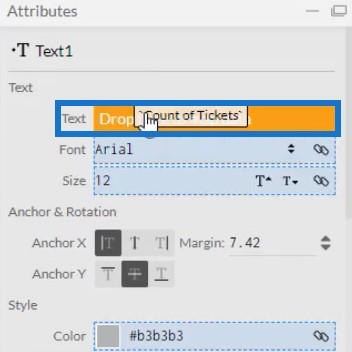
Next, input values on the bars by dragging Text into the Glyph and aligning them with the bar. Then, place Count of Tickets on the Text section of the Attributes to show the values. Change .1 to .0 to remove the decimal on the values.
Export To LuckyTemplates Report
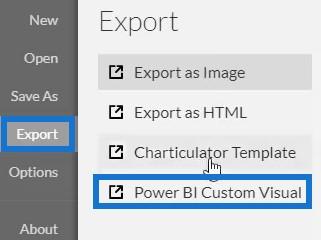
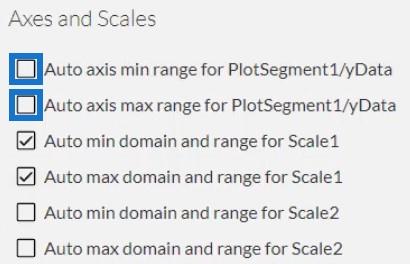
After all of this, you can now save the file and export it to LuckyTemplates Custom Visual. However, before you export the chart, uncheck the first two boxes in the Axes and Scales settings. These make your axes unchangeable when you change the filter context of the data.
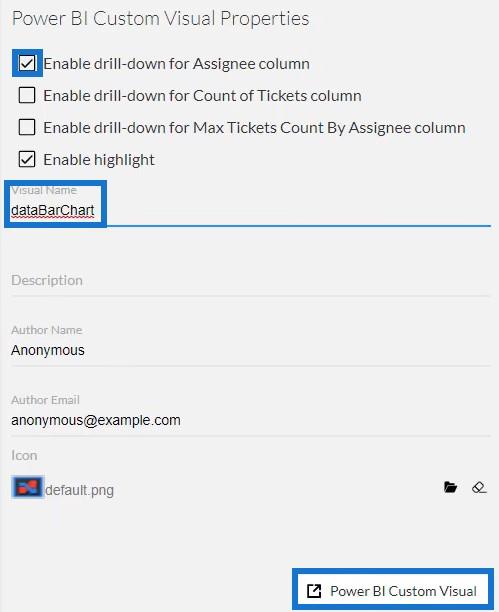
For the LuckyTemplates Custom Visual Properties settings, check the first box to enable drill-down for the Assignee column. Never enable drill-down for the next two boxes because your measures won’t work. Then, add a visual name without spaces and click LuckyTemplates Custom Visual to export the chart.
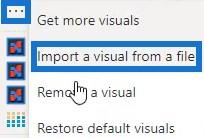
Next, open LuckyTemplates to import the file. Click the three dots below Visualizations and select Import a visual from a file. Then, import and open the bar chart file.
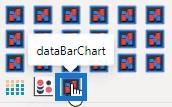
Click the Charticulator button with the visual name of the bar chart.
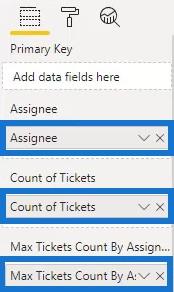
Fill the Fields section with the Assignee, Count Of Tickets, and Max Tickets Count By Assignee. The bar chart will now show.
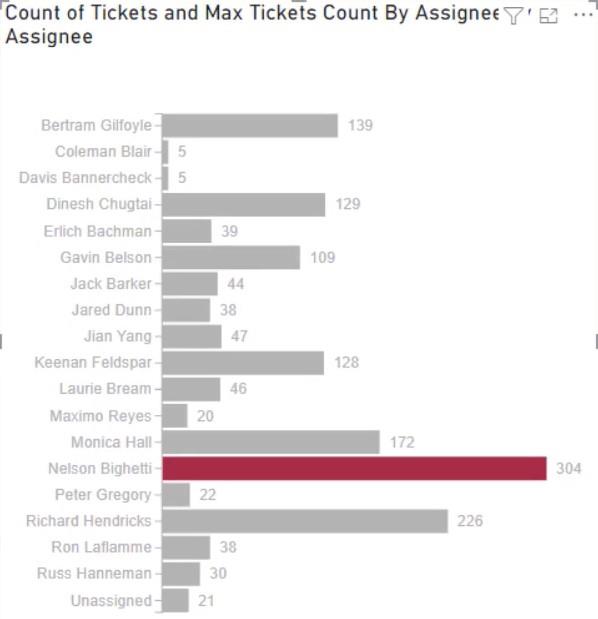
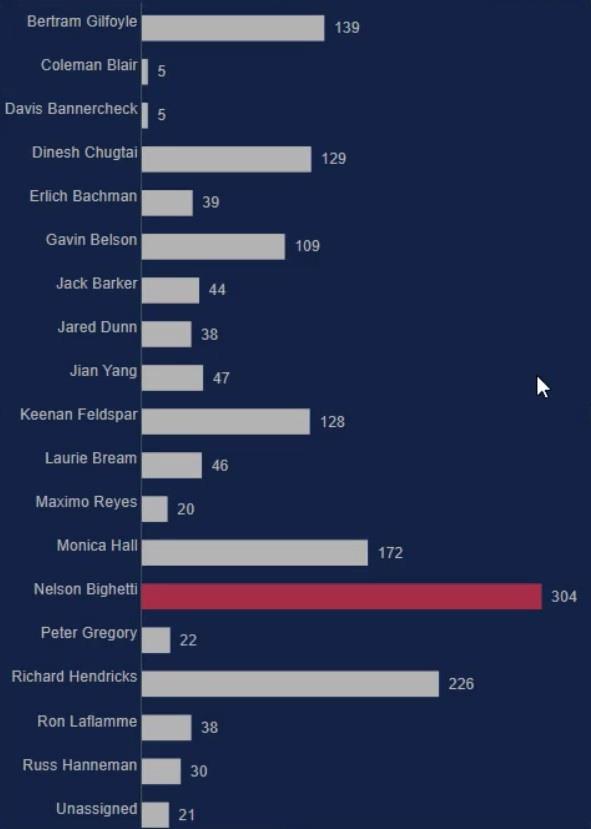
Finally, adjust the settings or attributes of the visualization to your own preference. You may change the font size and style, background color, and other details to get the visual you want. For this example, the final look of the visualization is this:
LuckyTemplates Desktop Update: The Charticulator Visual
Custom Bar Chart In LuckyTemplates: Varieties And Modification
LuckyTemplates Slope Chart: An Overview
Conclusion
Bar charts are effective visualizations because they help you visualize and understand your data easily. With Charticulator, creating charts is faster compared to the native custom visual in LuckyTemplates. You can access Charticulator in the website and export your data to any data reporting tool effortlessly.
Learn more about creating charts and visualizations with Charticulator by going through this in the LuckyTemplates website.
Mudassir
Excel hücrelerini metne sığdırmak için güncel bilgileri ve 4 kolay çözümü keşfedin.
Bir Excel Dosyasının Boyutunu Küçültmek için 6 Etkili Yöntem. Hızlı ve kolay yöntemler ile verilerinizi kaybetmeden yer açın.
Python'da Self Nedir: Gerçek Dünyadan Örnekler
R'de bir .rds dosyasındaki nesneleri nasıl kaydedeceğinizi ve yükleyeceğinizi öğreneceksiniz. Bu blog aynı zamanda R'den LuckyTemplates'a nesnelerin nasıl içe aktarılacağını da ele alacaktır.
Bu DAX kodlama dili eğitiminde, GENERATE işlevinin nasıl kullanılacağını ve bir ölçü başlığının dinamik olarak nasıl değiştirileceğini öğrenin.
Bu eğitici, raporlarınızdaki dinamik veri görselleştirmelerinden içgörüler oluşturmak için Çok Kanallı Dinamik Görseller tekniğinin nasıl kullanılacağını kapsayacaktır.
Bu yazıda, filtre bağlamından geçeceğim. Filtre bağlamı, herhangi bir LuckyTemplates kullanıcısının başlangıçta öğrenmesi gereken en önemli konulardan biridir.
LuckyTemplates Apps çevrimiçi hizmetinin çeşitli kaynaklardan oluşturulan farklı raporların ve içgörülerin yönetilmesine nasıl yardımcı olabileceğini göstermek istiyorum.
LuckyTemplates'da ölçü dallandırma ve DAX formüllerini birleştirme gibi teknikleri kullanarak kâr marjı değişikliklerinizi nasıl hesaplayacağınızı öğrenin.
Bu öğreticide, veri önbelleklerini gerçekleştirme fikirleri ve bunların DAX'ın sonuç sağlama performansını nasıl etkilediği tartışılacaktır.


