Excel Hücrelerini Metne Sığdırma: 4 Kolay Çözüm

Excel hücrelerini metne sığdırmak için güncel bilgileri ve 4 kolay çözümü keşfedin.
In this tutorial, I’ll be talking about how to use dummy variables in writing better DAX measures. This is especially applicable in cases where more complex DAX is needed. Using this technique, you can be more flexible in dealing with different variables and conditionals. You may watch the full video of this tutorial at the bottom of this blog.
I decided to do this tutorial because of a question I encountered in the .
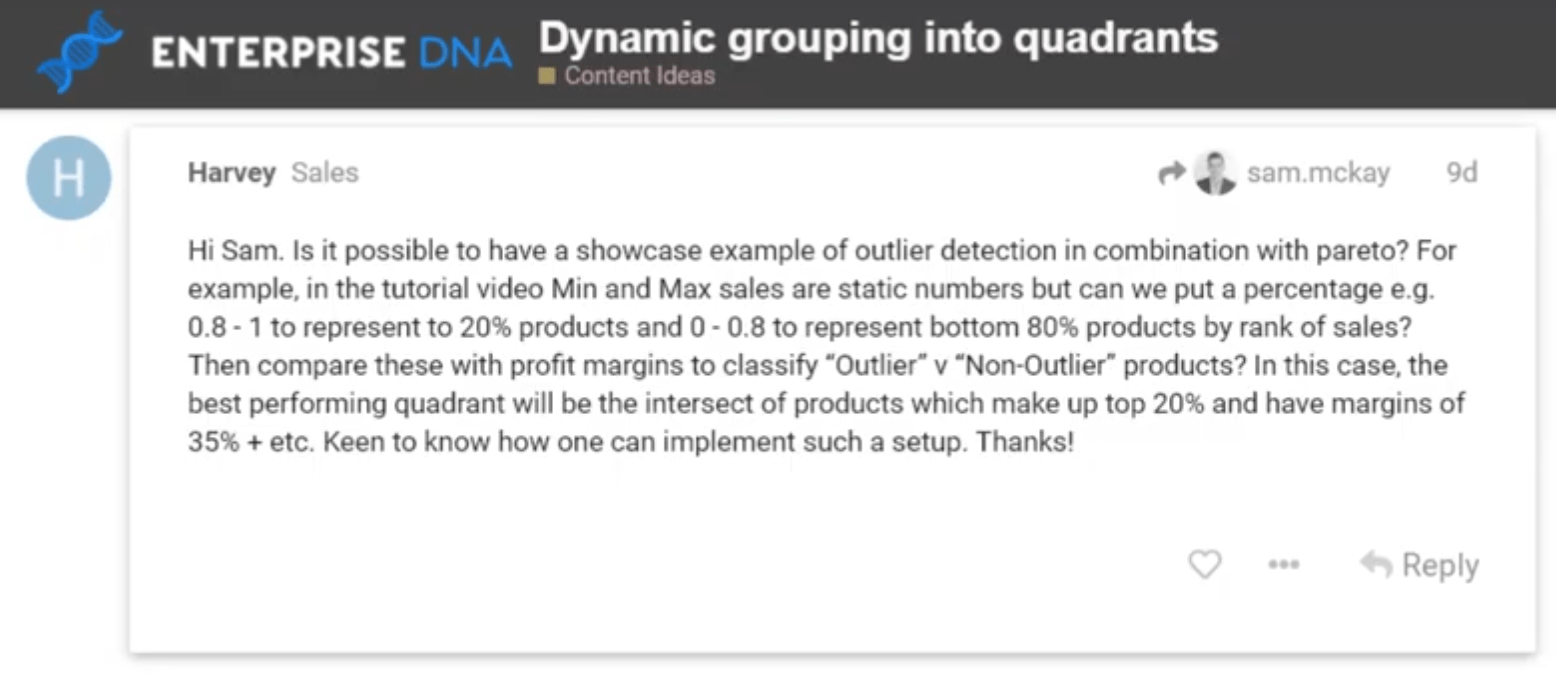
Based on this question, Harvey wanted to combine a Pareto analysis with some additional criteria. He wanted to look at the top 20% of the sales rank while also looking at its intersection with other products that had margins over a certain percentage.
Table of Contents
Drafting Solution For Sales Rank And Profit Margin Cutoff
Based on the requirements Harvey mentioned, I created a draft solution that has sliders for the Sales Rank and the Profit Margin Cutoff.
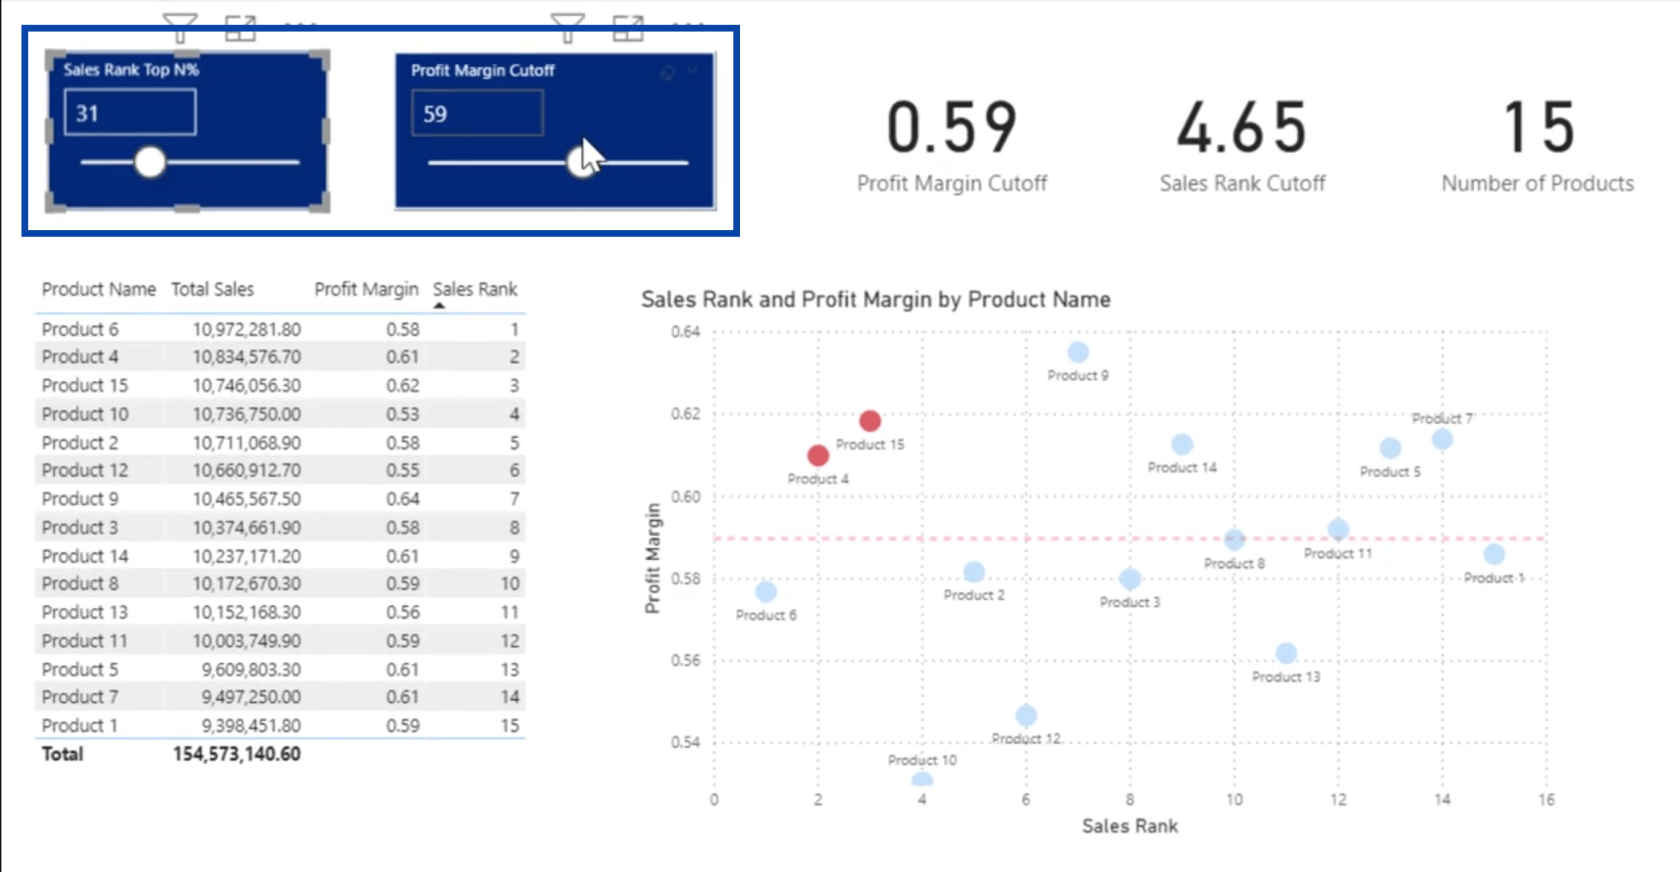
Depending on the parameters you set on those sliders, the scatter visualization will show the products that meet both criteria.
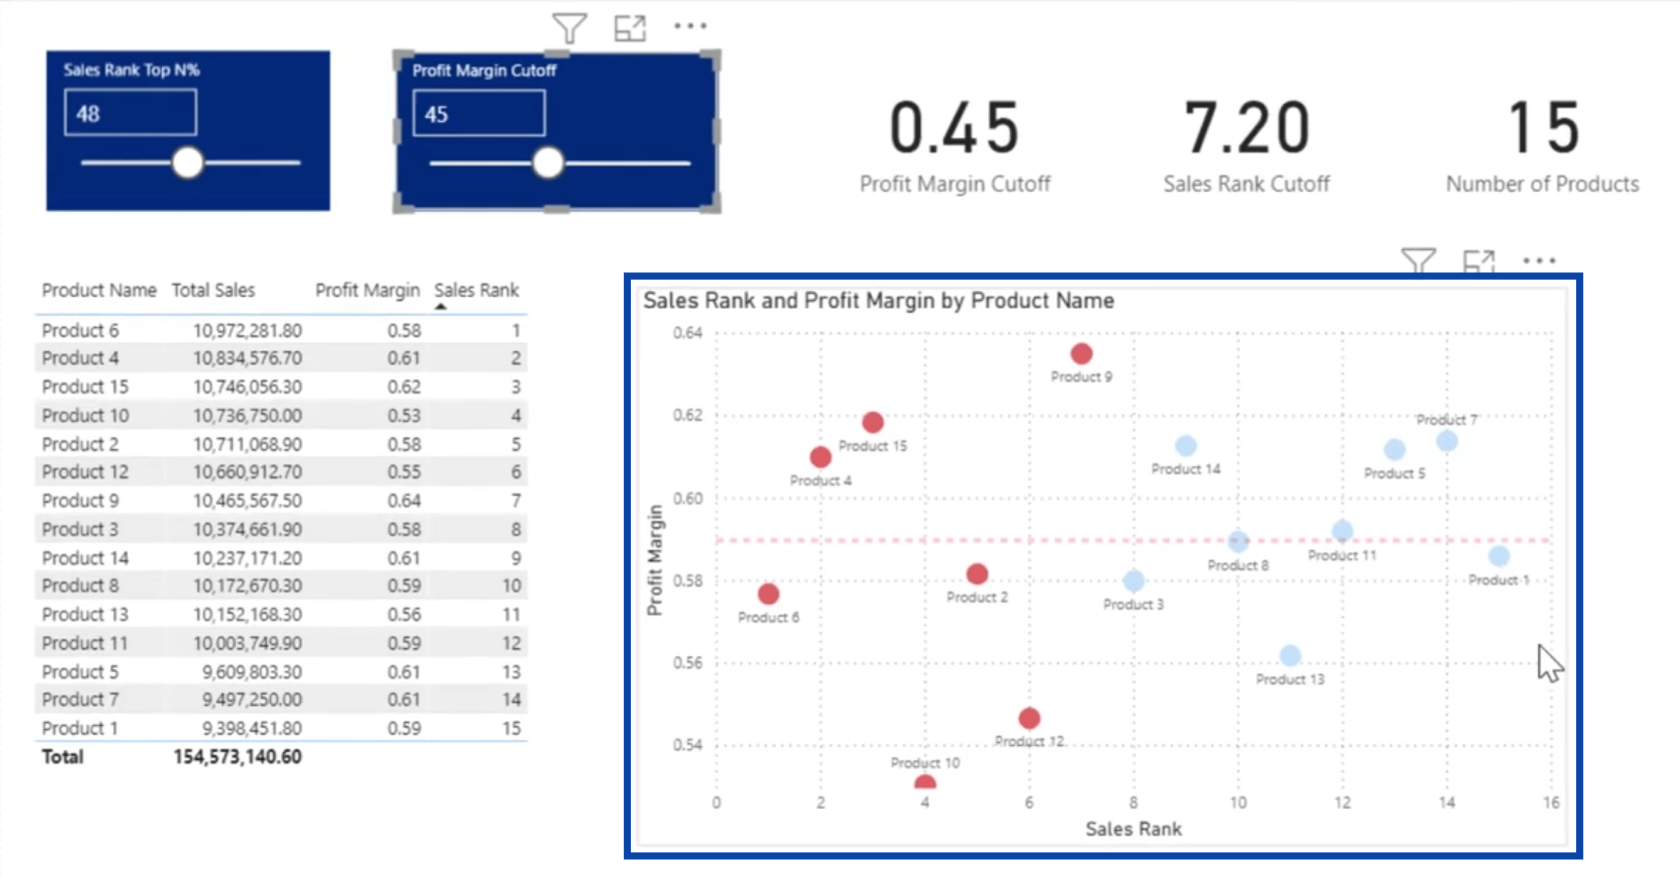
Let’s say that the Sales Rank is A and the Profit Margin is B. This basically shows an condition. This requires relatively standard DAX measures. These are shown here on the right pane under measures, where I have the Sales Rank, which uses a basic . I also have Total Costs, Total Profits, and other variables that get their values from the sliders.
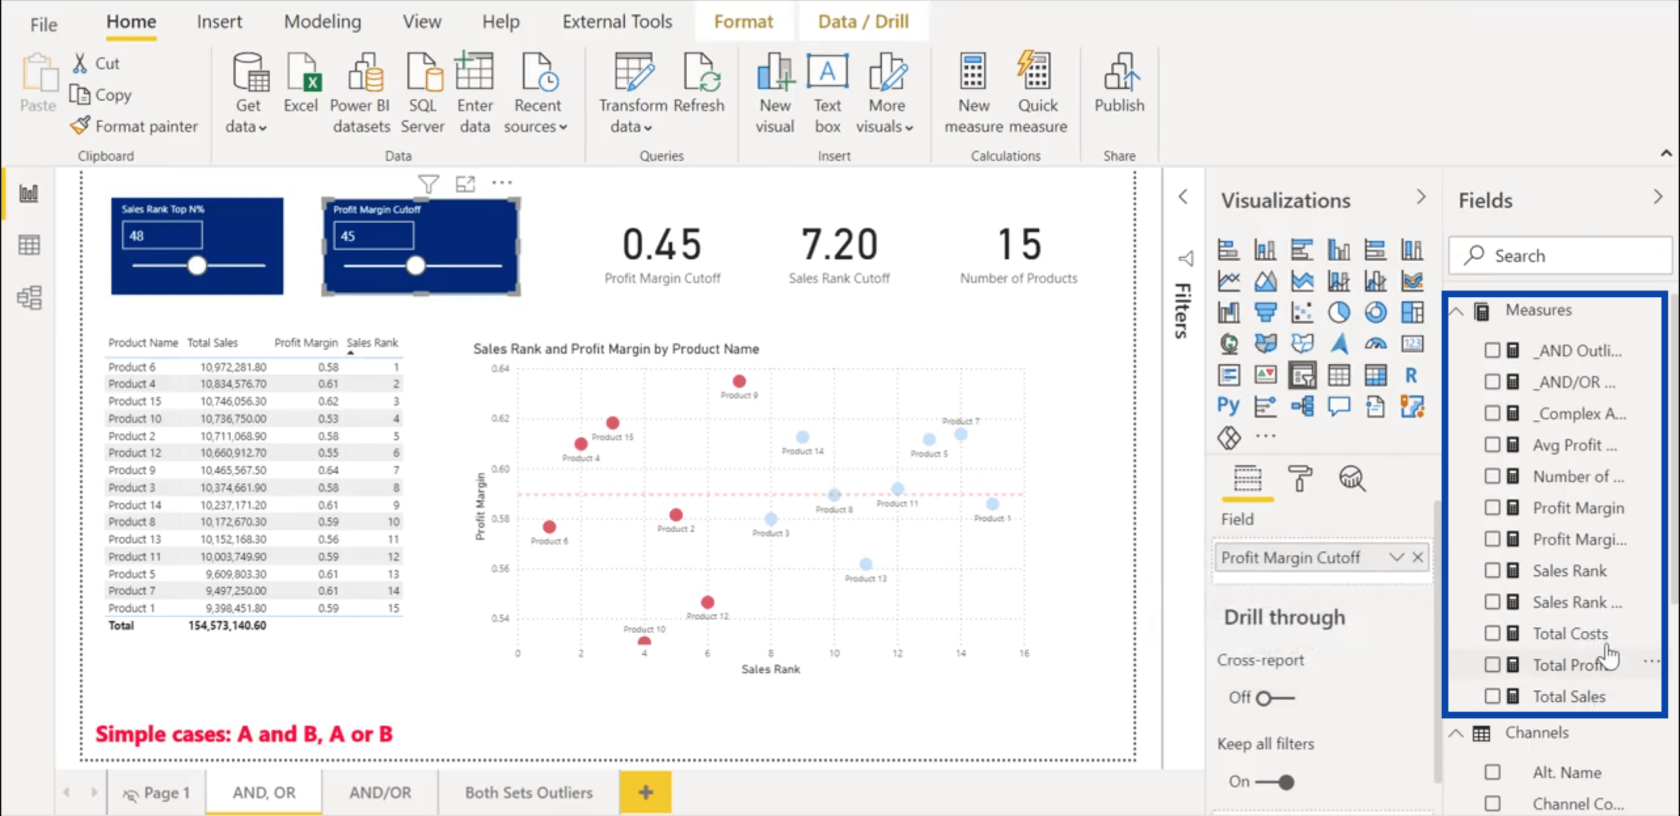
Using Dummy Variables For AND Conditions
As for the AND condition, it’s this measure that does the heavy lifting.
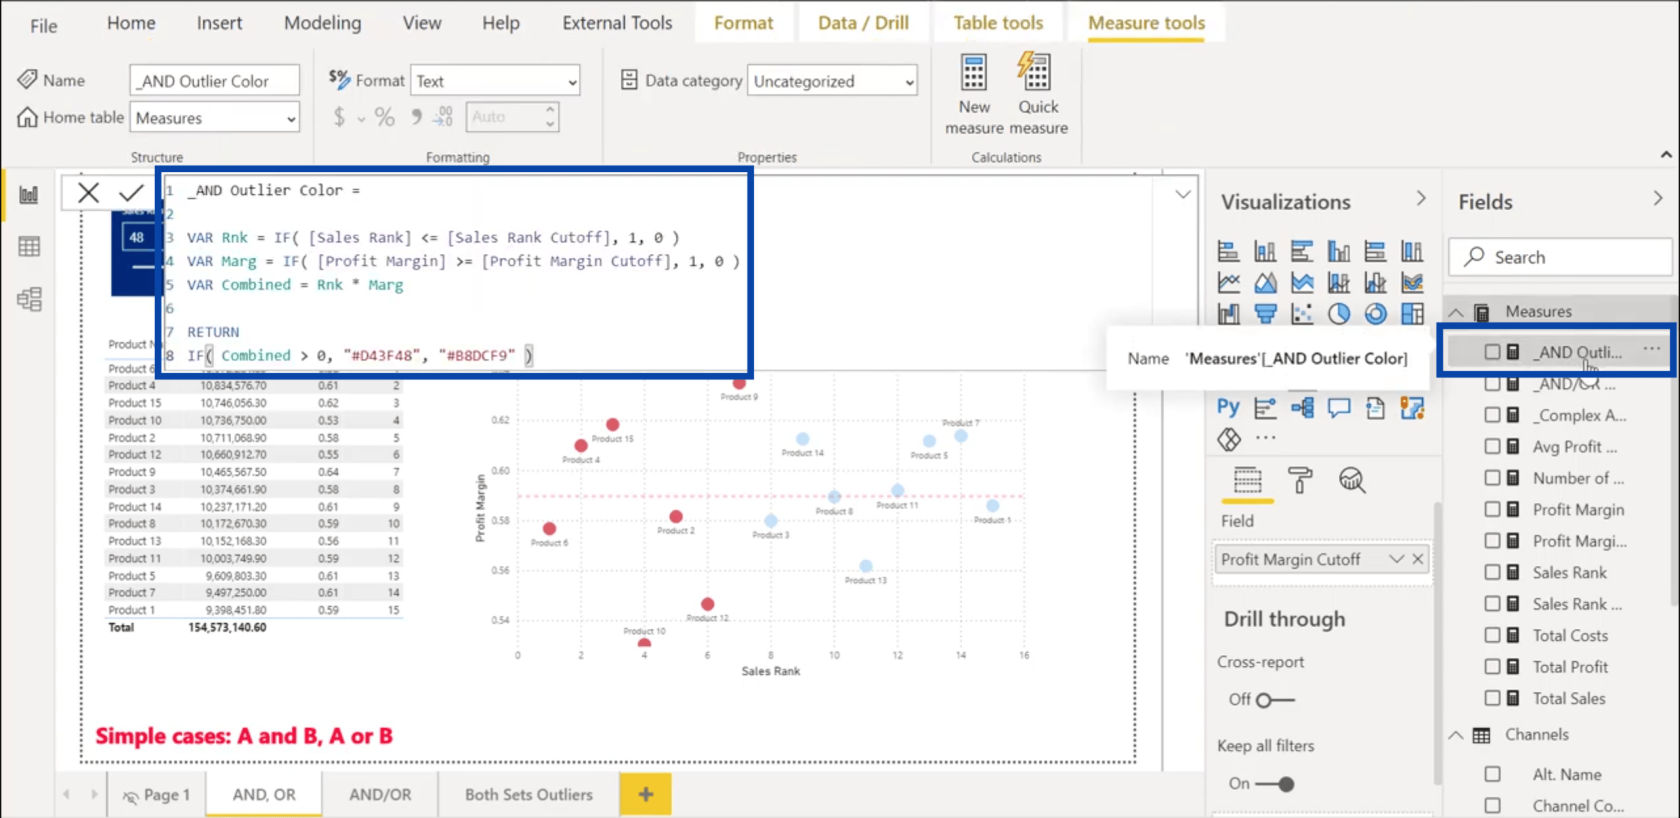
There are a couple of interesting things you might notice in this measure. Basically, these conditionals are usually used in a / criteria. But instead of doing that, I used what I call dummy variables where if the condition is TRUE, it gets a 1. If it’s FALSE, it gets a 0.

So this measure shows that if Sales Rank is less than or equal to the Sales Rank Cutoff, it gets a 1. If Profit Margin is greater than the Profit Margin Cutoff, it gets a 1. Otherwise, they get a zero.
This approach is very common in statistical and regression analysis but it can also be useful when it comes to DAX.
I used that approach because I need those values for the next part where I combine those two variables by multiplying them.

Once the two dummy variables Rnk and Marg are combined, I can then move on to the next part of the measure. If that combined value is greater than zero, I assigned the red color. If it’s not, it is assigned the blue color.

Using Dummy Variables For OR Conditions
What if you want to use this approach in an condition?
You can use the same process, but when it comes to the step where you combine the variables, use a plus sign instead of an asterisk.
So an AND condition would require an asterisk like this:

An OR condition would require a plus sign like this:

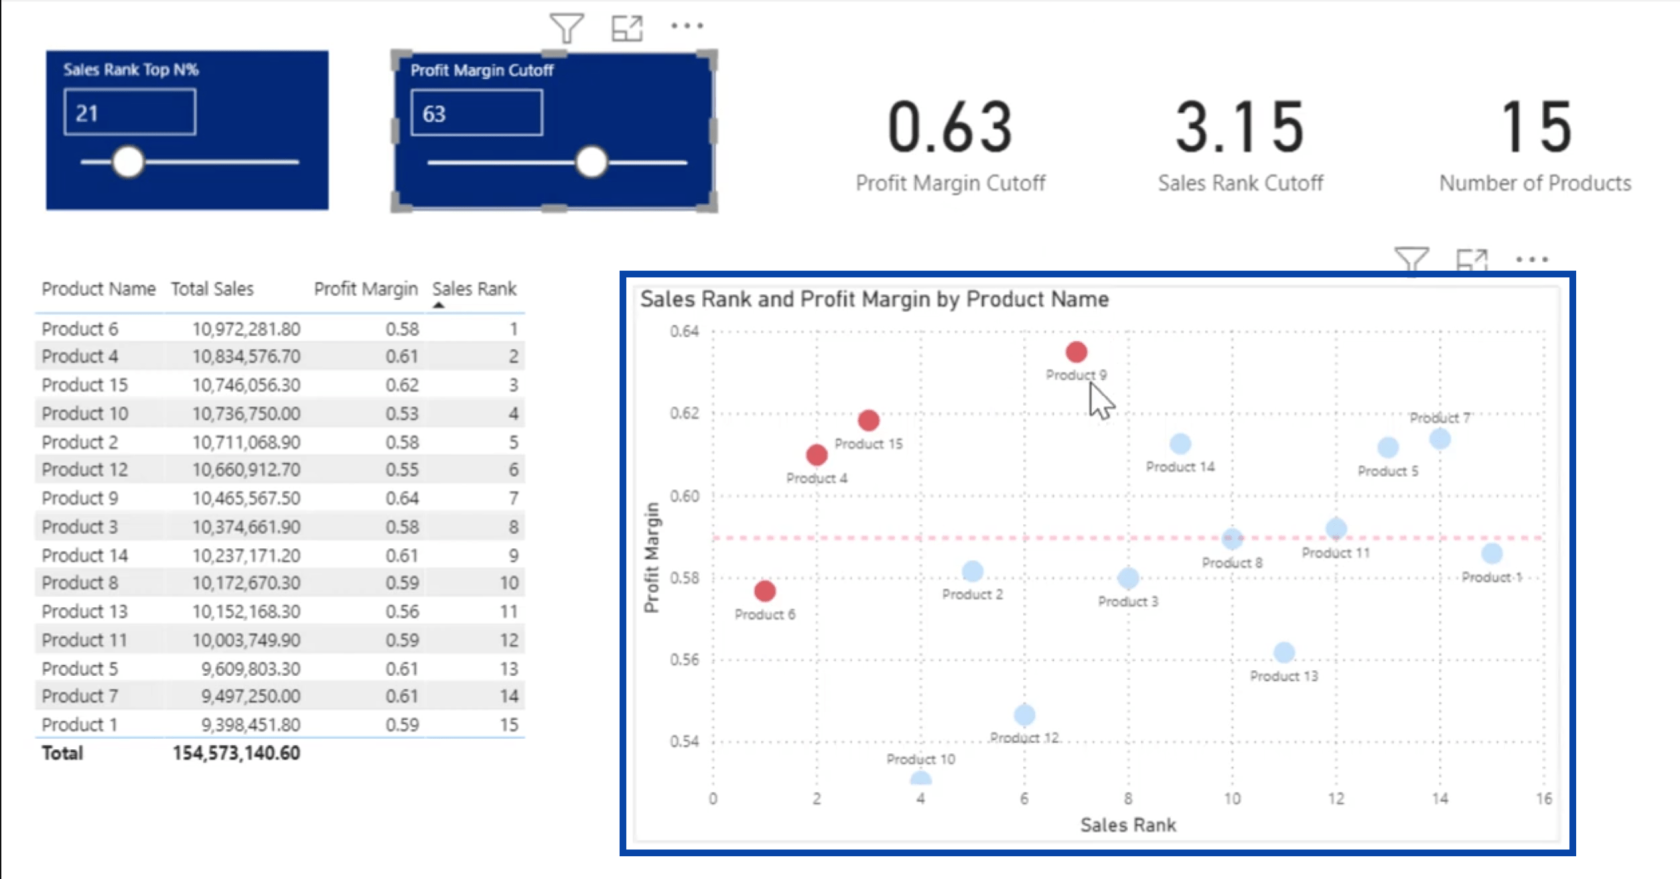
Once you hit accept, it will apply those conditions onto the scatter chart. The products meeting those set conditions will then show up as these red dots here.
Why The Dummy Variables Work
If you’re wondering why these dummy variables work, I have some diagrams here that could help.
Let’s start with the AND condition.
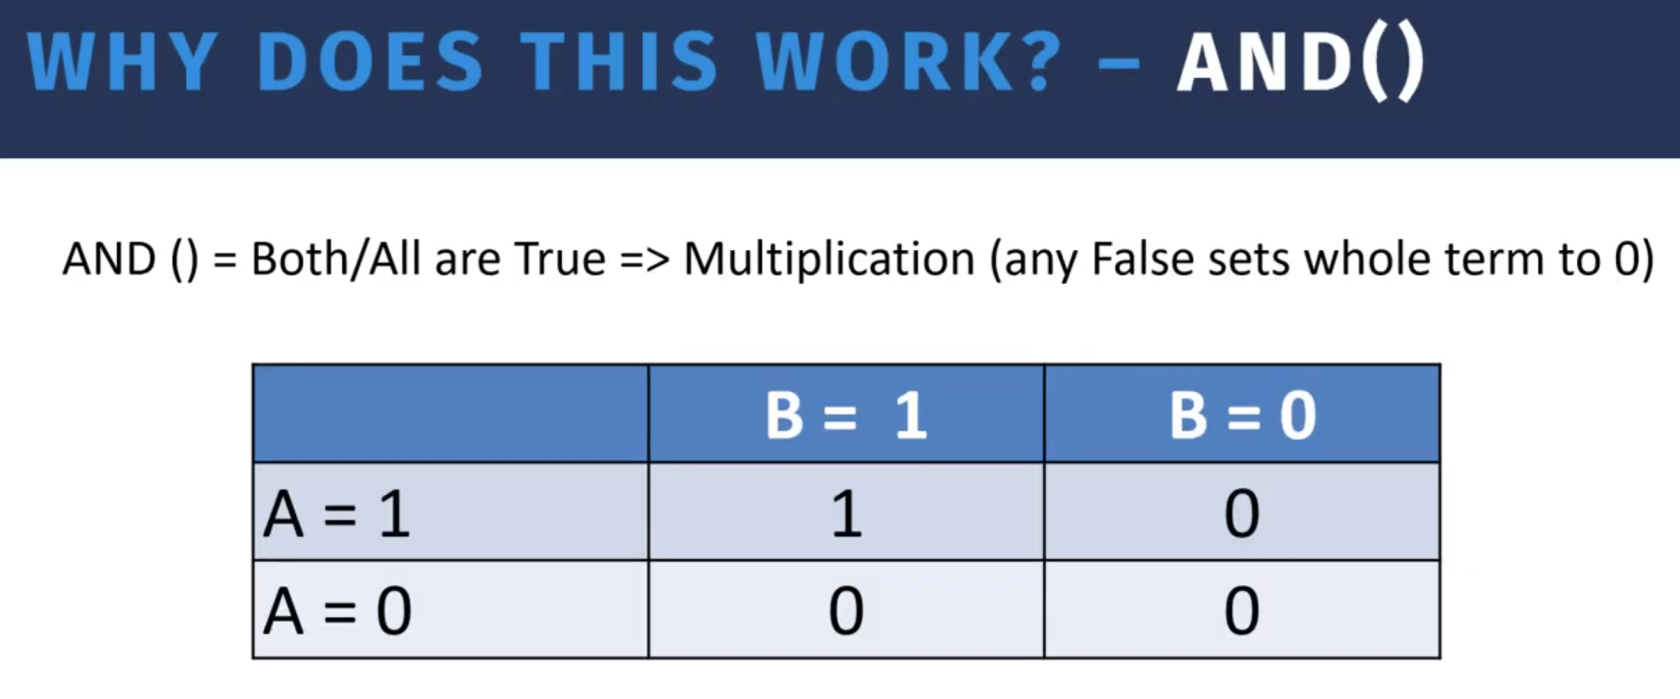
AND implies that both or all conditions are TRUE. This is characterized by multiplication. Once multiplied, any FALSE condition sets the whole term to 0. So if you have two variables, A and B, and both are true, that would give a product of 1, which returns a TRUE.
But if either A equals zero or B equals zero, you get three conditions where the whole term will end up with zero. That’s the intersection.
If we look at the OR condition, on the other hand, it means that either or any of the conditions are TRUE. Instead of multiplication, this requires addition. So no single FALSE set will result to 0, but as long as any one condition is true, it increments that condition up by 1.
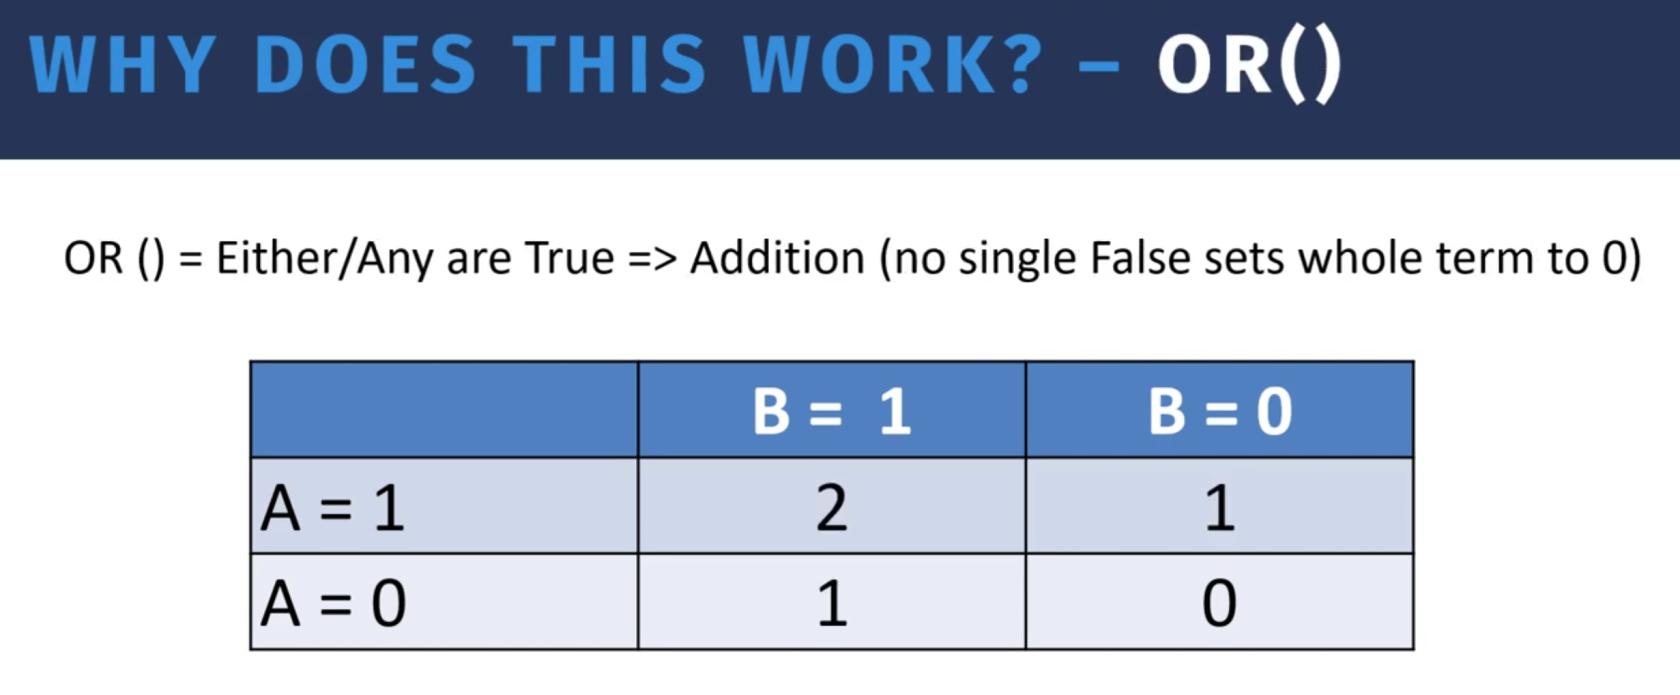
So in the diagram for the OR condition, if both A and B are TRUE then the term gets a 2. If A is false but B is true, it gets a 1. The reverse also gets a 1, while you only get a 0 if both conditions are false.
Where Dummy Variables Are Useful
Evidently, you can use basic AND or OR conditions for simple cases. However, those won’t work as well when it comes to more complex cases. Here’s one example.

This case shows seven variables. The combination of A, B and C are TRUE. So are the combinations of either D and E or F and G.
If you were to write a DAX measure for this condition, you can just imagine how lengthy and messy that would be. But if you apply dummy variables, then you can make it a lot simpler. You just need to substitute those operators to get the simpler formula.

From there, you use the condition that if the result is greater than 0, that would be TRUE. If it turns out to be equal to 0 then you get a FALSE.
Let’s go back to the LuckyTemplates file to see how that works in an actual report.
So in this case, the red dots show an instance where both conditions are true, while the purple dots show that only one condition is true.
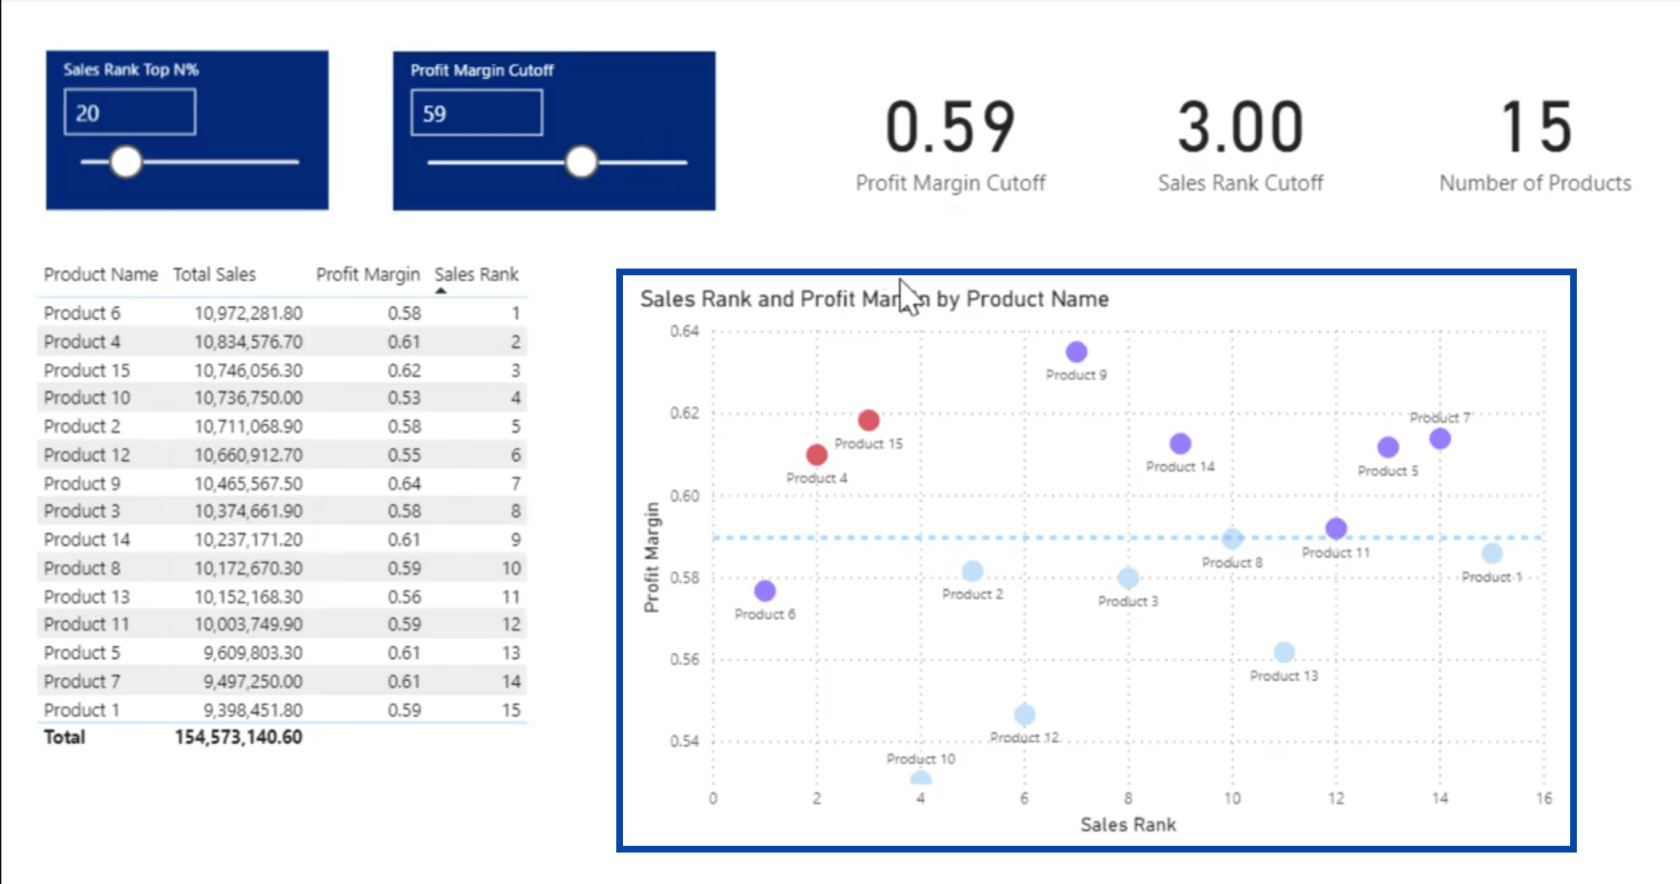
Going into the measure, you’ll see the dummy variables Rnk and Marg where we have an OR condition as shown by the plus.

Then, you’ll also see that under the TRUE construct, you have a 2 resulting in red, which means that you have two TRUE statements. If one of the statements is true, it turns purple. If neither are true then that results in a 0, which will show you blue dots.

That corresponds directly to the OR diagram matrix we talked about earlier.
Going back to our last condition, we can look at what happens if we want to look at two sets of outliers. Basically, if we want to look at what meets both conditions A and B, the two dots up here representing Products 4 and 15 meet that criteria.
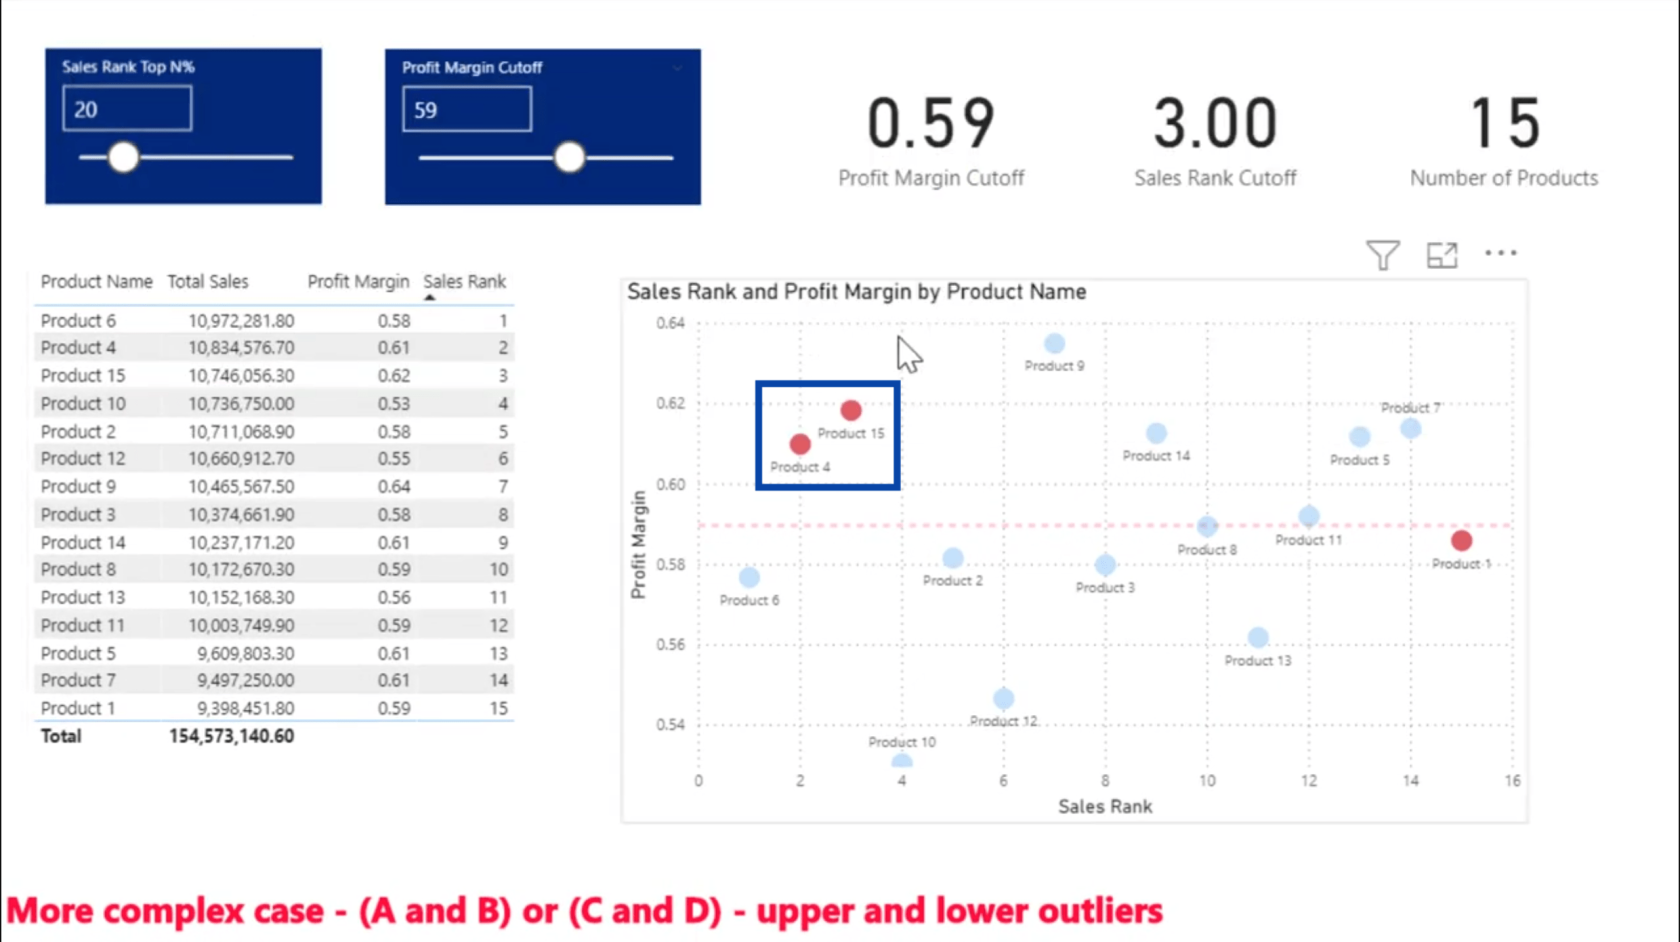
On the flip side, you can also look at the bottom outlier, which is Product 1.
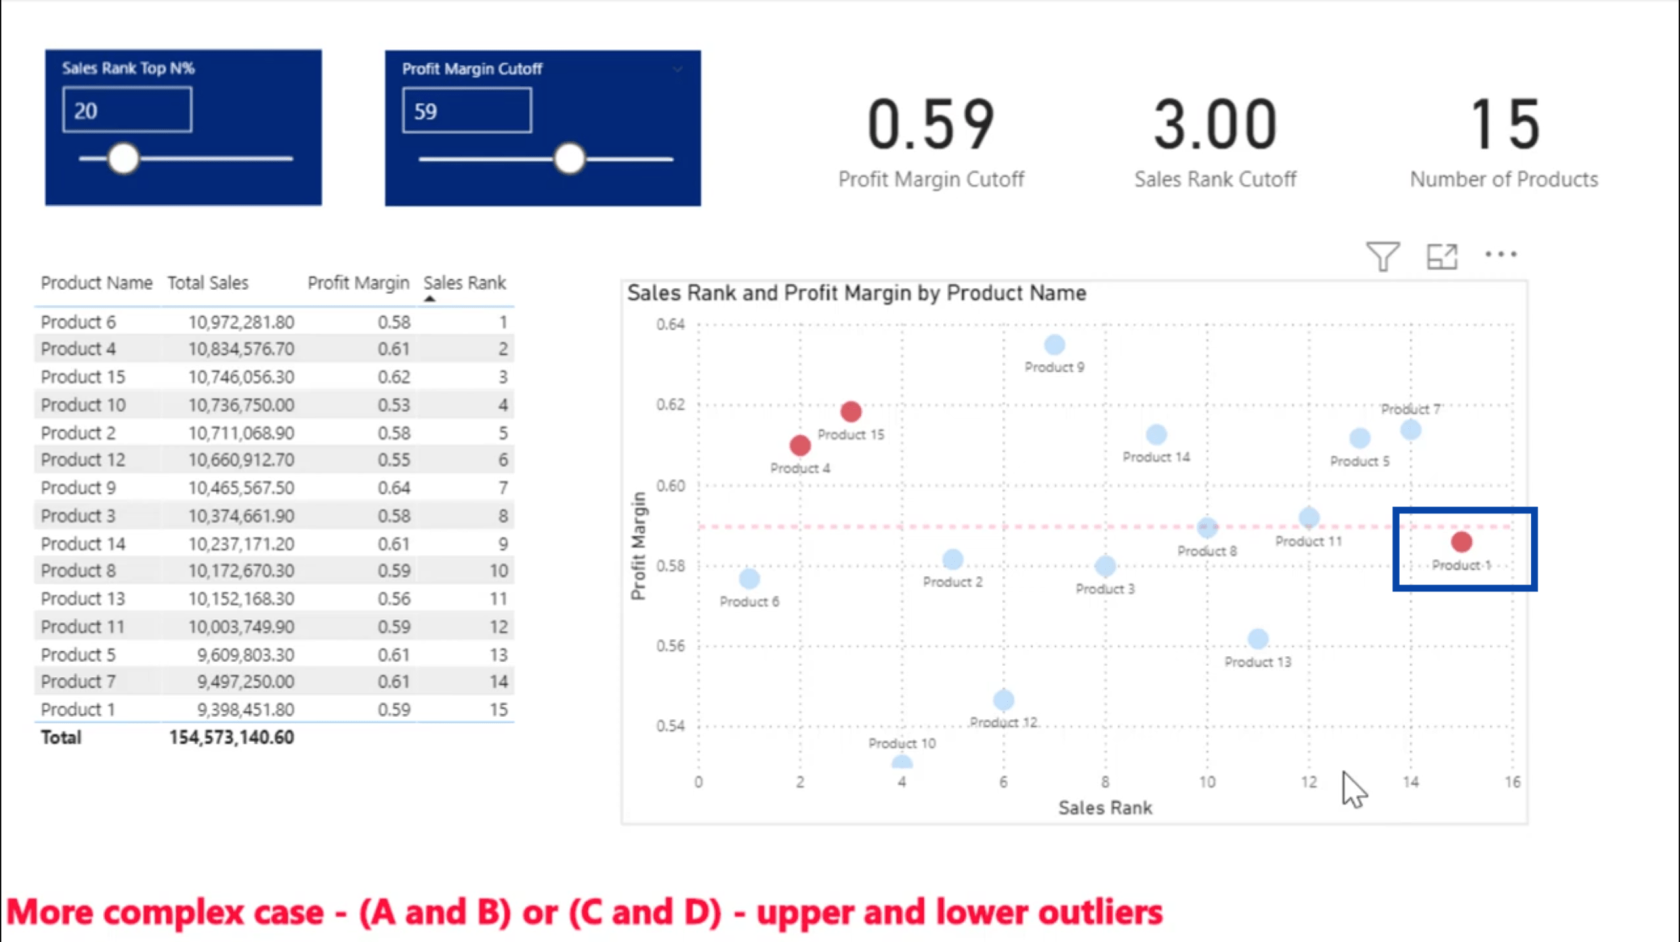
Remember also that this entire report is dynamic. So the more you move your sliders around, the more points you’ll potentially see.
Looking at the measure below, it shows the final case we talked about where you have four dummy variables — the top rank (TopRnk), the values greater than or equal to the margin (GTEMarg), the bottom rank (BotRank), and the less than or equal to margin (LEMar).

Looking at the combined value, we multiplied the TopRnk and GTEMarg, and then added that to the product of the BotRank and LEMarg.

If any of those conditions return as TRUE then that will show a red point on the chart. If not, it would show a blue point.

Using Advanced DAX For Multiple IF Statement In LuckyTemplates
How To Use SWITCH True Logic In LuckyTemplates
DAX Functions In LuckyTemplates: Using Iterators
Conclusion
By using and combining these dummy variables, you can get the results you want using simple measures compared to the usual complicated DAX measures that textual TRUE/FALSE measures require.
Start trying this approach on other reports you have that used TRUE or FALSE conditions in the past and see how that affects your measures as you make the conditions more complicated.
All the best,
Excel hücrelerini metne sığdırmak için güncel bilgileri ve 4 kolay çözümü keşfedin.
Bir Excel Dosyasının Boyutunu Küçültmek için 6 Etkili Yöntem. Hızlı ve kolay yöntemler ile verilerinizi kaybetmeden yer açın.
Python'da Self Nedir: Gerçek Dünyadan Örnekler
R'de bir .rds dosyasındaki nesneleri nasıl kaydedeceğinizi ve yükleyeceğinizi öğreneceksiniz. Bu blog aynı zamanda R'den LuckyTemplates'a nesnelerin nasıl içe aktarılacağını da ele alacaktır.
Bu DAX kodlama dili eğitiminde, GENERATE işlevinin nasıl kullanılacağını ve bir ölçü başlığının dinamik olarak nasıl değiştirileceğini öğrenin.
Bu eğitici, raporlarınızdaki dinamik veri görselleştirmelerinden içgörüler oluşturmak için Çok Kanallı Dinamik Görseller tekniğinin nasıl kullanılacağını kapsayacaktır.
Bu yazıda, filtre bağlamından geçeceğim. Filtre bağlamı, herhangi bir LuckyTemplates kullanıcısının başlangıçta öğrenmesi gereken en önemli konulardan biridir.
LuckyTemplates Apps çevrimiçi hizmetinin çeşitli kaynaklardan oluşturulan farklı raporların ve içgörülerin yönetilmesine nasıl yardımcı olabileceğini göstermek istiyorum.
LuckyTemplates'da ölçü dallandırma ve DAX formüllerini birleştirme gibi teknikleri kullanarak kâr marjı değişikliklerinizi nasıl hesaplayacağınızı öğrenin.
Bu öğreticide, veri önbelleklerini gerçekleştirme fikirleri ve bunların DAX'ın sonuç sağlama performansını nasıl etkilediği tartışılacaktır.


