Excel Hücrelerini Metne Sığdırma: 4 Kolay Çözüm

Excel hücrelerini metne sığdırmak için güncel bilgileri ve 4 kolay çözümü keşfedin.
In this tutorial, you’ll learn how to create a new type of bar chart visualization called Fill Bar Chart. It’s a chart that shows the current and total value of a category, then gives an image of a bar chart being filled. You’ll also learn how to turn it into a new variety of donut chart using polar coordinates.
Table of Contents
Exporting A Dataset To Charticulator
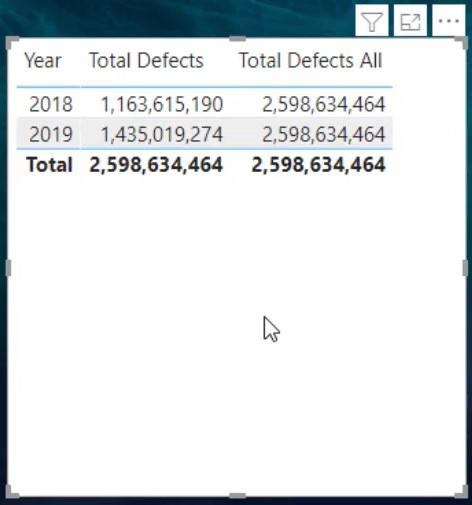
First, create and export a dataset to Charticulator. The dataset used in this example contains Year, Total Defects, and Total Defects All.
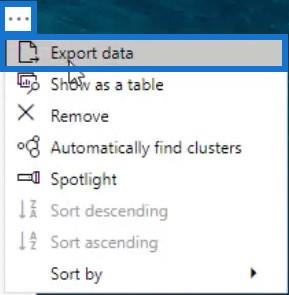
Click the ellipsis on the table and select Export Data.
Next, go to charticulator.com and click Launch Charticulator.

Then, locate and open the exported dataset. After that, you’ll be redirected in the Charticulator canvas.
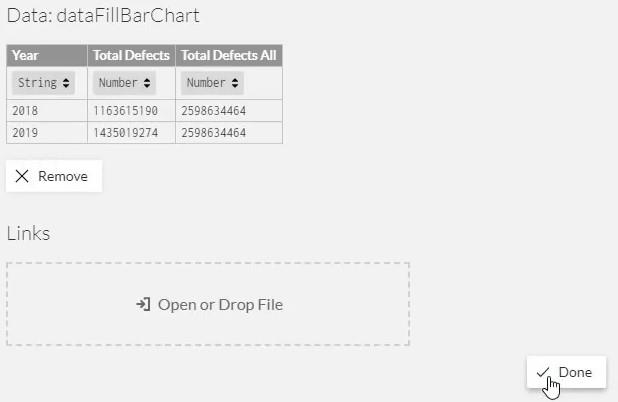
Designing The Fill Bar Chart
Create the main shape of the chart by placing a rectangle in the Glyph canvas.
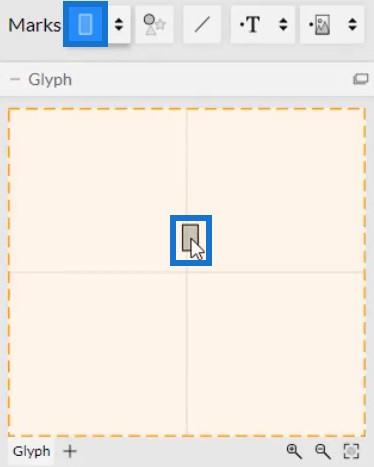
Change the stacking of the bars to Stack Y.

Now, you need to put the measures in the x-axis. Click Data Axis and place it on the x-axis of the rectangle inside Glyph.

Place it from the bottom left to the bottom right of the axis. Data Axis allows an axis to have multiple measures in it.
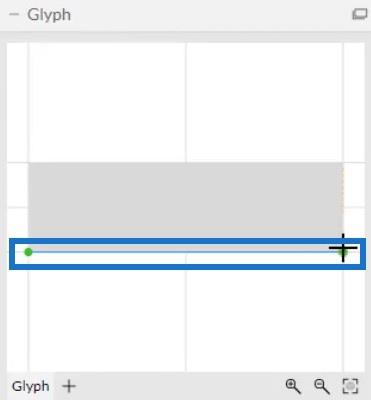
Once done, put Total Defects and Total Defects All in the Data Axis inside the Glyph canvas.
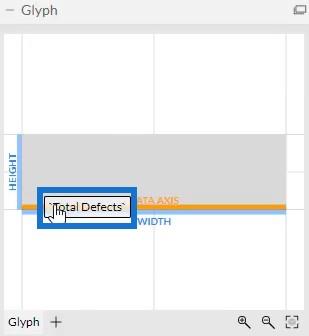
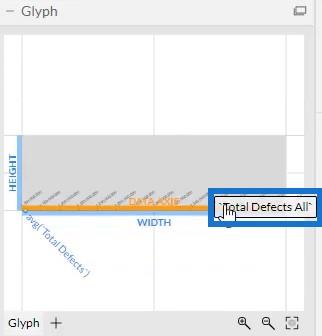
Your chart will then look like this.
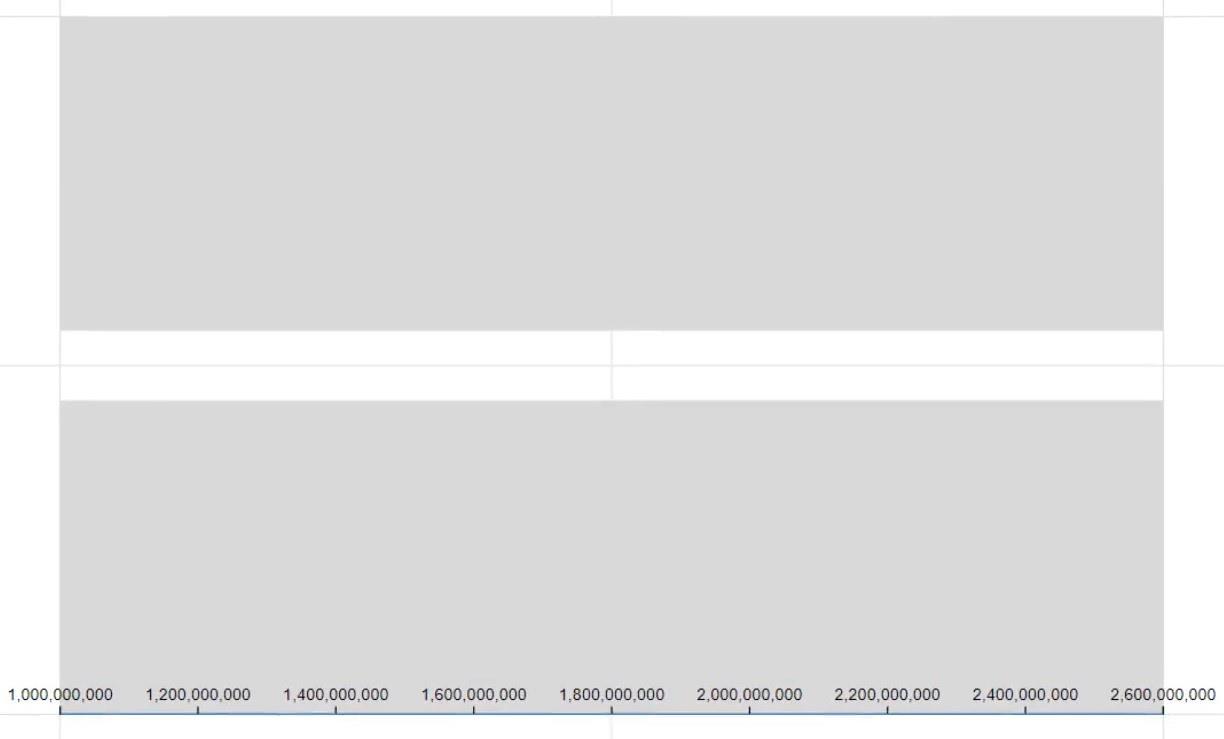
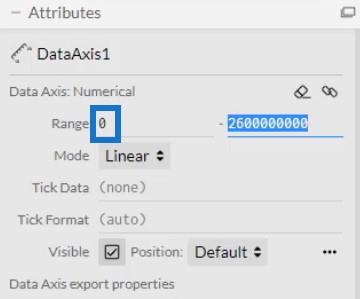
In the DataAxis1’s Attributes, set the Range to 0 so that the values on the x-axis will start at 0.
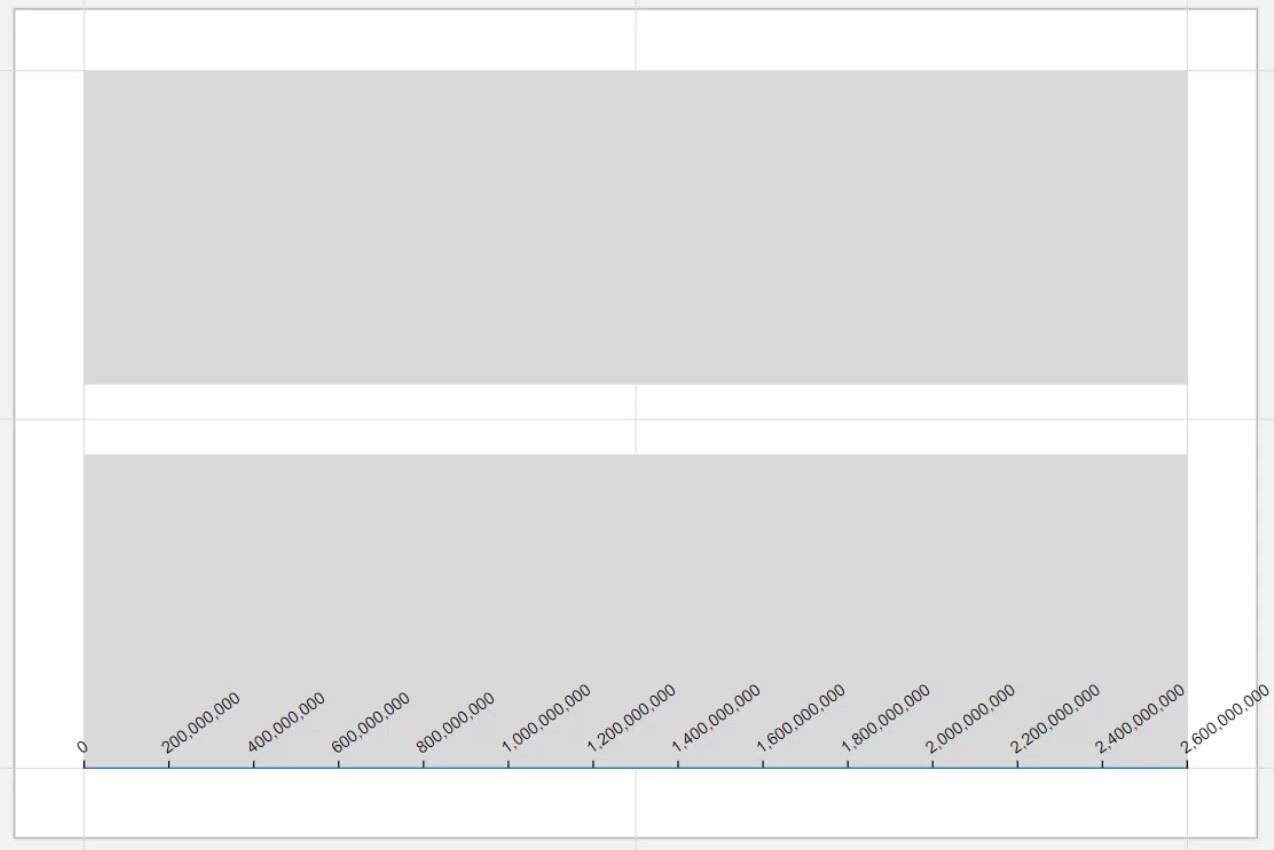
Next, delete the rectangle in the Glyph canvas and define the shapes of the measures. Place a rectangle in the Glyph from the left side to the point of the first measure.
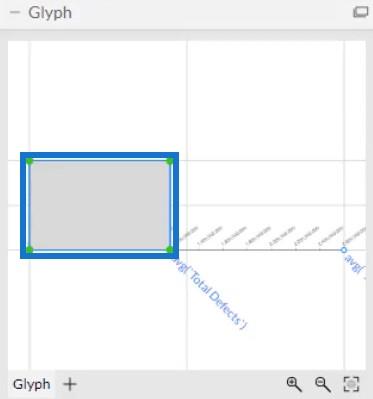
For the second measure, place a rectangle from the point of the first measure to the end of the axis.
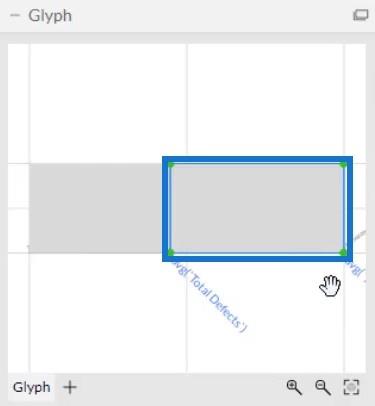
Adding Colors To Fill Bars
Add colors to each bar in the chart. Open Shape1’s Attributes and place Total Defects in the Width section.
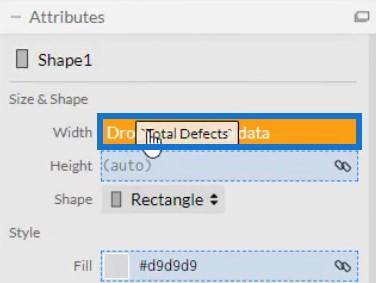
If you add a color in the Fill section of Shape1’s Attributes, you’ll see that the bar for the current value is emphasized.
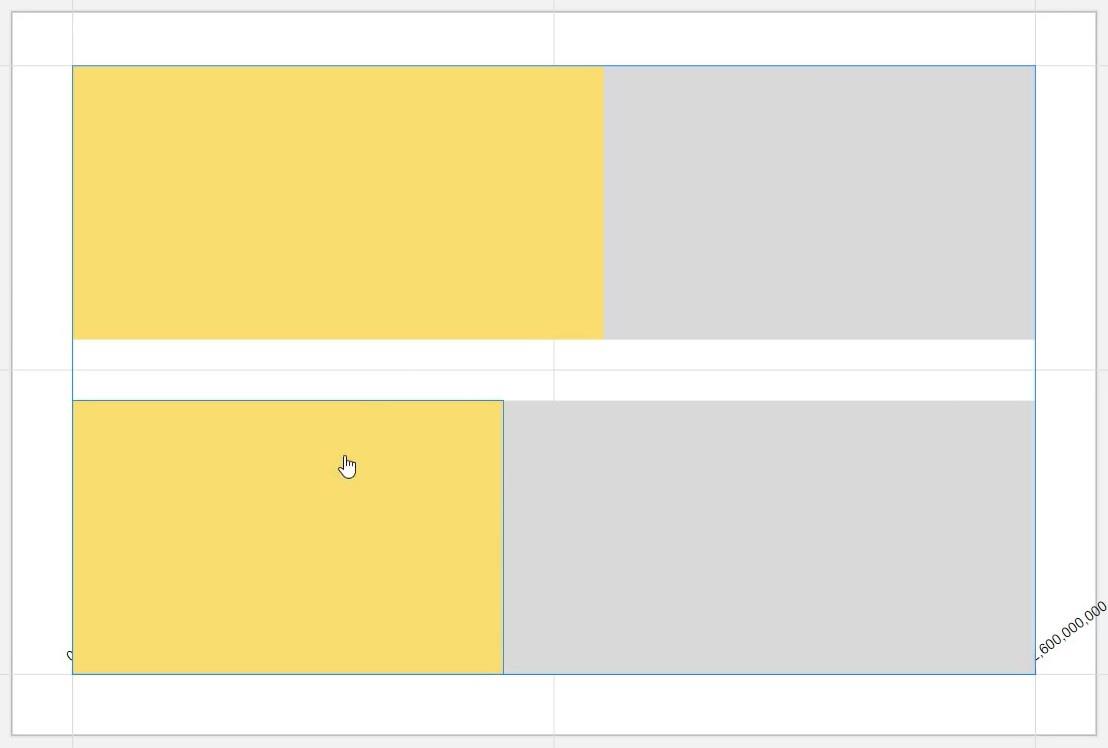
The yellow bar is the current value while the gray bar is the total value. It is now giving the image of the current value filling the total value.
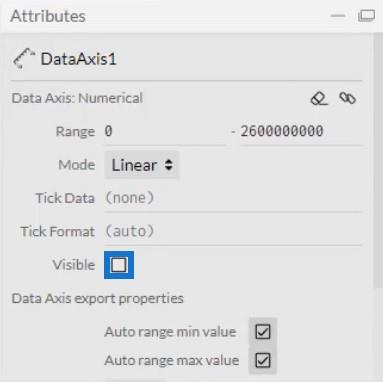
Hide the Data Axis by opening DataAxis1’s Attributes and unchecking the Visible box.
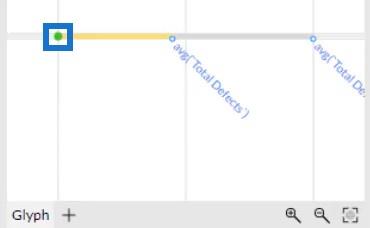
Next, reduce and adjust the size of the bars in the Shapes’ Attributes. Add circles in the Glyph canvas to make it look like a round bar chart. Drag two circles from Marks to Glyph and align them at both ends of the bar.
Adjust the size of the circles to match the size of the bars. Your Fill Bar chart will now look like this.

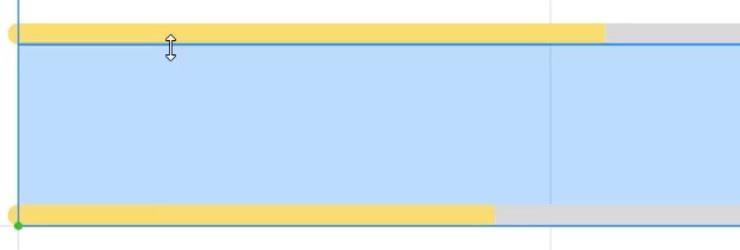
Lastly, create a gap between the bars by dragging one bar away from the other.
Exporting The Fill Bar Chart To LuckyTemplates
Save the file and export it to LuckyTemplates Custom Visual.
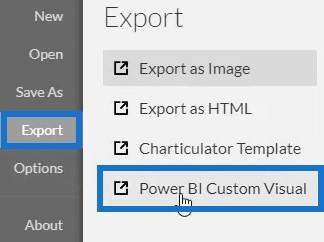
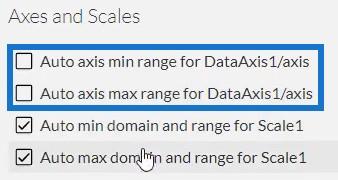
Uncheck the auto axis options in the Axes and Scales settings to avoid changes in the axes when a filter context transition is invoked. Then, input a visual name and export the chart file.
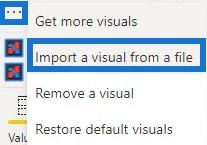
Open LuckyTemplates and import the Fill Bar chart file. Click the ellipsis below Visualizations and select Import a visual from a file.
Locate and open the file. Then, click the Charticulator icon with the visual name of the file. You will then see the visual in the dashboard.

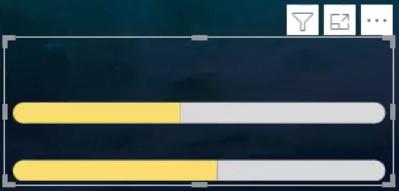
Adjust the margins and the background to match your data report and preference. Once done, the Fill Bar chart will now look like this.
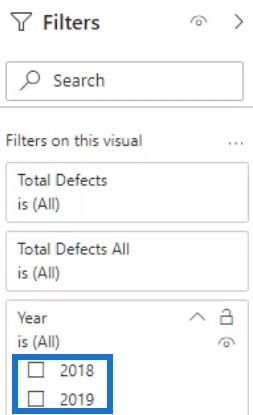
If you only want to show one bar in your report, go to the Filter section and set the filter type to Basic Filtering. You’ll see a filter selection for the years 2018 and 2019. Then, check the box of the year that you want to display in your report.
You can also use another chart to invoke context transitions. For this example, a simple bar chart is used. Go to the Format tab and click Edit Interactions. Next, create an interaction between the Fill Bar chart and bar chart.

If you select a bar in the bar chart or any chart that you used, you will see that the Fill Bar Chart will change.

Transforming The Chart Using Polar Coordinates
Another thing you can do is turn the bar chart into a donut chart. Remove the circles from both ends of the bar and then drag Polar to the canvas. You’ll see that the Fill Bar chart is now a Fill Donut Chart.
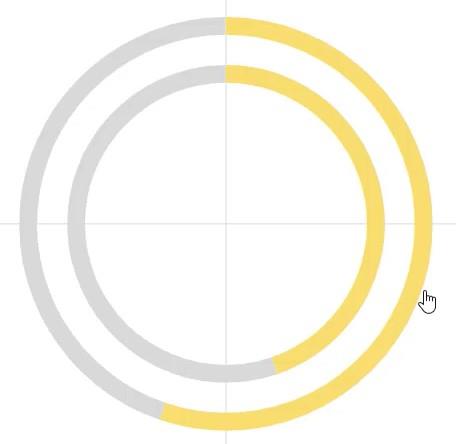
Comparison Bar Charts With Charticulator In LuckyTemplates
Create A Bar Chart Visualization With Charticulator
Conclusion
If you want a new look for your bar charts, try practicing and utilizing this tutorial. Fill Bar charts will help make your LuckyTemplates reports look more interesting. They also make all the data and information inside the chart easier to understand.
Learn more about Fill Bar charts or Charticulator by reading related modules about charts and visualizations. You can practice the modules using your own data to improve your data development skills.
Mudassir
Excel hücrelerini metne sığdırmak için güncel bilgileri ve 4 kolay çözümü keşfedin.
Bir Excel Dosyasının Boyutunu Küçültmek için 6 Etkili Yöntem. Hızlı ve kolay yöntemler ile verilerinizi kaybetmeden yer açın.
Python'da Self Nedir: Gerçek Dünyadan Örnekler
R'de bir .rds dosyasındaki nesneleri nasıl kaydedeceğinizi ve yükleyeceğinizi öğreneceksiniz. Bu blog aynı zamanda R'den LuckyTemplates'a nesnelerin nasıl içe aktarılacağını da ele alacaktır.
Bu DAX kodlama dili eğitiminde, GENERATE işlevinin nasıl kullanılacağını ve bir ölçü başlığının dinamik olarak nasıl değiştirileceğini öğrenin.
Bu eğitici, raporlarınızdaki dinamik veri görselleştirmelerinden içgörüler oluşturmak için Çok Kanallı Dinamik Görseller tekniğinin nasıl kullanılacağını kapsayacaktır.
Bu yazıda, filtre bağlamından geçeceğim. Filtre bağlamı, herhangi bir LuckyTemplates kullanıcısının başlangıçta öğrenmesi gereken en önemli konulardan biridir.
LuckyTemplates Apps çevrimiçi hizmetinin çeşitli kaynaklardan oluşturulan farklı raporların ve içgörülerin yönetilmesine nasıl yardımcı olabileceğini göstermek istiyorum.
LuckyTemplates'da ölçü dallandırma ve DAX formüllerini birleştirme gibi teknikleri kullanarak kâr marjı değişikliklerinizi nasıl hesaplayacağınızı öğrenin.
Bu öğreticide, veri önbelleklerini gerçekleştirme fikirleri ve bunların DAX'ın sonuç sağlama performansını nasıl etkilediği tartışılacaktır.


