Excel Hücrelerini Metne Sığdırma: 4 Kolay Çözüm

Excel hücrelerini metne sığdırmak için güncel bilgileri ve 4 kolay çözümü keşfedin.
In this Report Builder tutorial, you’ll learn how to add a table in a paginated report. Other Microsoft products, such as Excel and Word, require you to input data in each cell in a table.
When you’re dealing with thousands of rows of data, creating and editing tables becomes taxing. However, it’s easy to create tables in Report Builder.
This is a continuation of the Report Builder tutorial on adding texts and images.
Table of Contents
Report Builder Tutorial Step 1: Creating A Basic Table
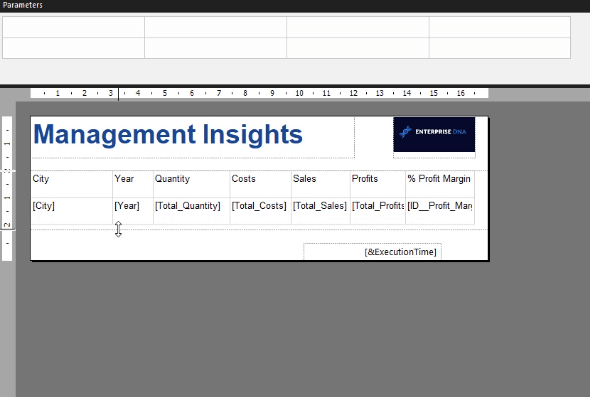
To add a table in Report Builder, click the Insert tab. Under the Insert tab, click Table and then Insert Table.

Place your mouse pointer over your report page and drag it to manually form a table.
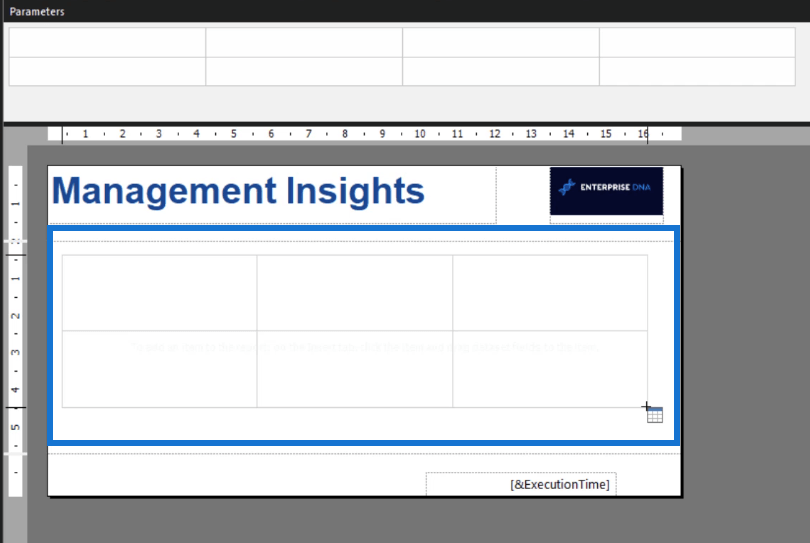
To add data in the table, you can drag and drop items from your datasets to specific columns in your table.
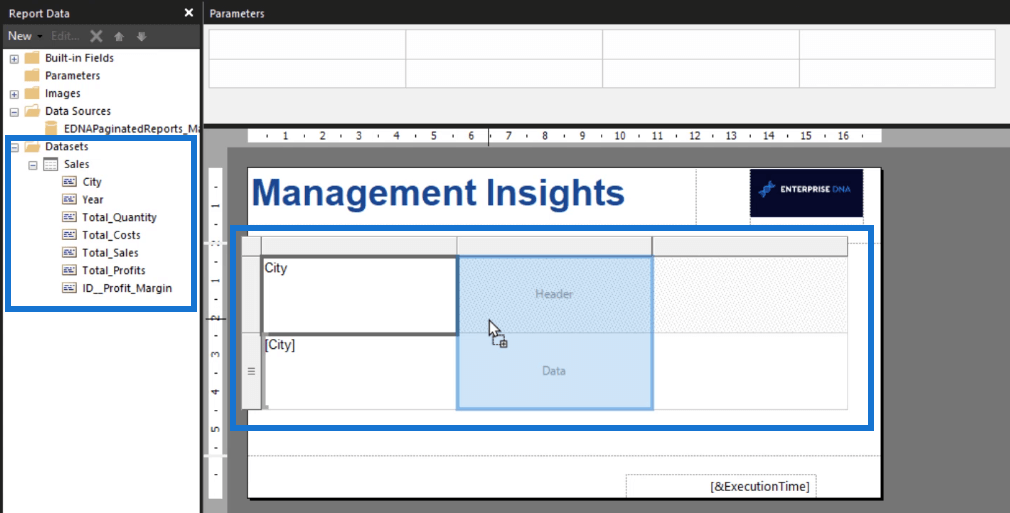
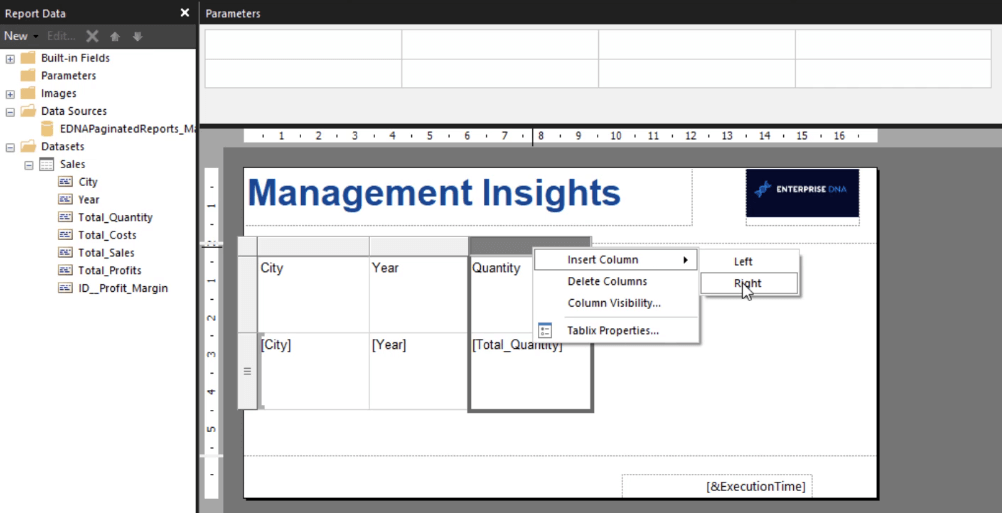
You can resize your columns and manually change the names of the column headers. To add more columns in your table, right-click on the table and choose Insert Column. Continue doing so until you’re satisfied with how your table looks.
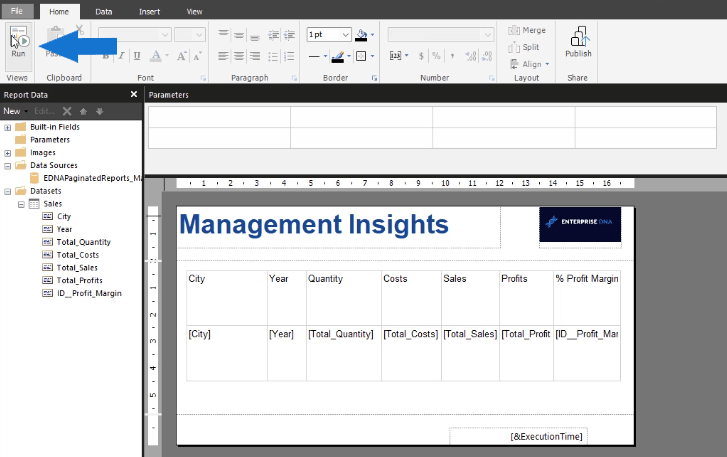
Unlike Excel and Word, you don’t have to input the data under every column. Tables in Report Builder pull data from your database and place them straight into your table. To view what your final table looks like, click the Run button under the Home tab.
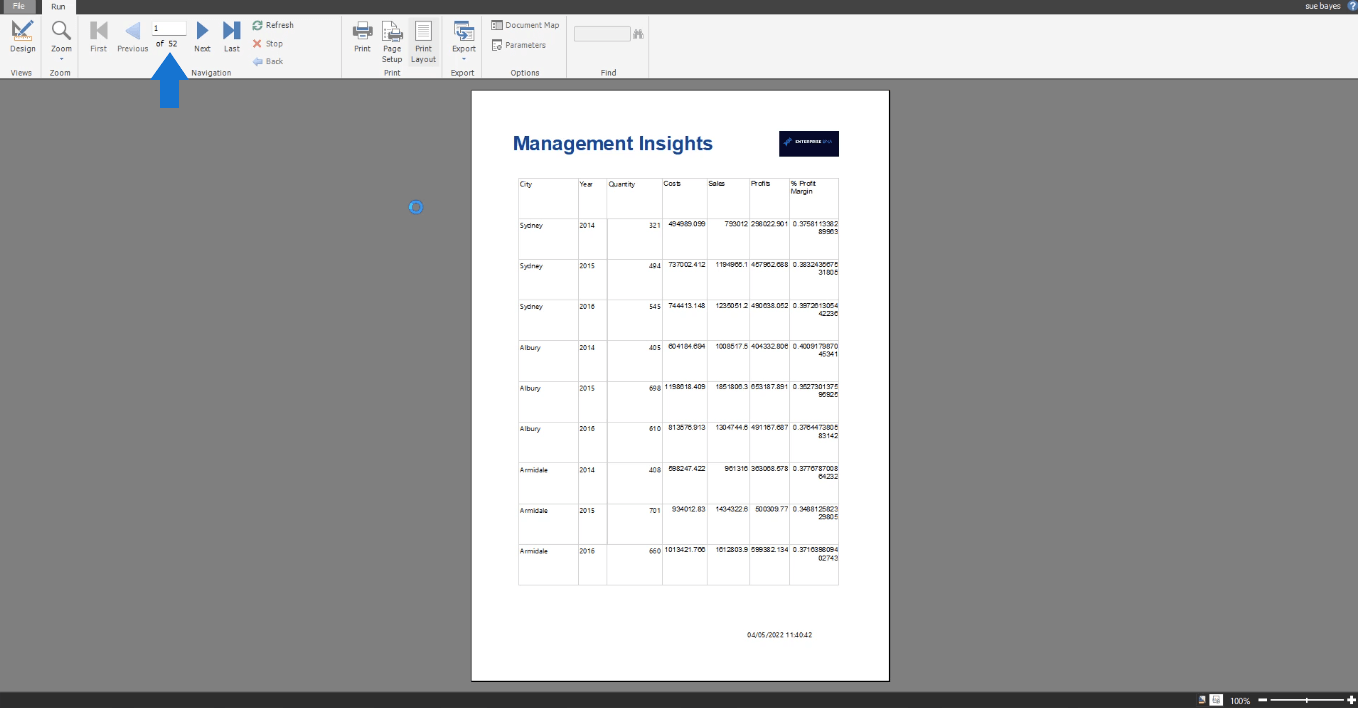
In this example, you can see that the table now ends with rows covering 52 pages of the report. You can flip through the pages using the Previous and Next buttons. In its current form, the table looks untidy and unprofessional.
Report Builder Tutorial Step 2: Cleaning Up The Table
In Report Builder, a table is called a Tablix. You can change the name of a table using the Properties pane on the right. It’s always good practice to properly name tables so that it’s easier for you to locate them.
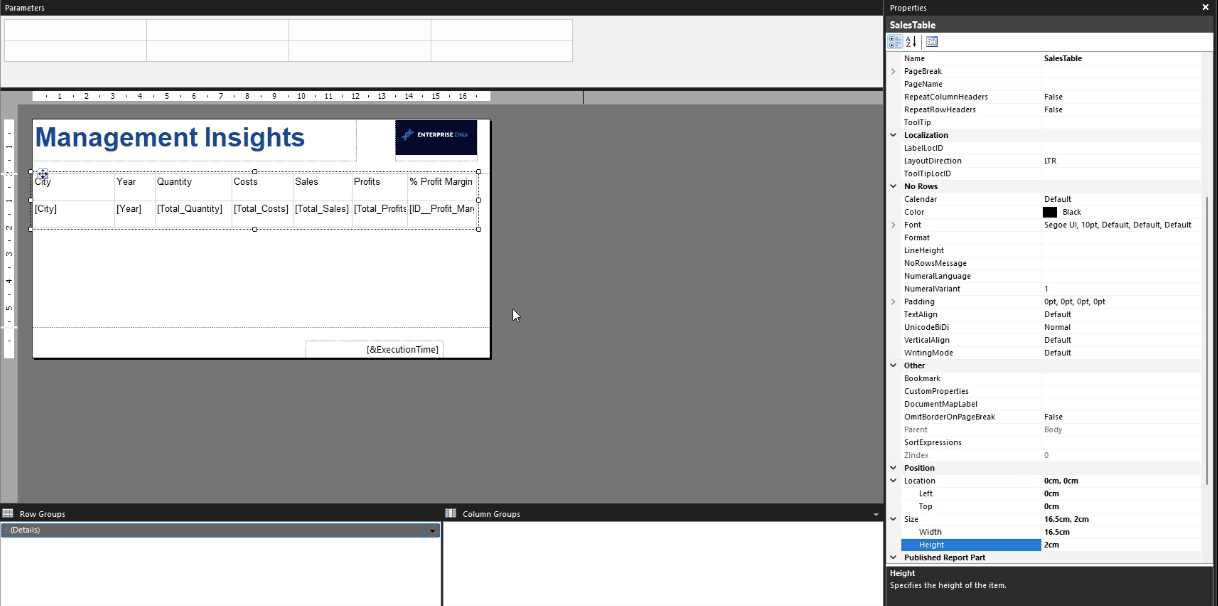
One of the ways to tidy up a table is to customize the Position settings. This includes the location of the table and its size.
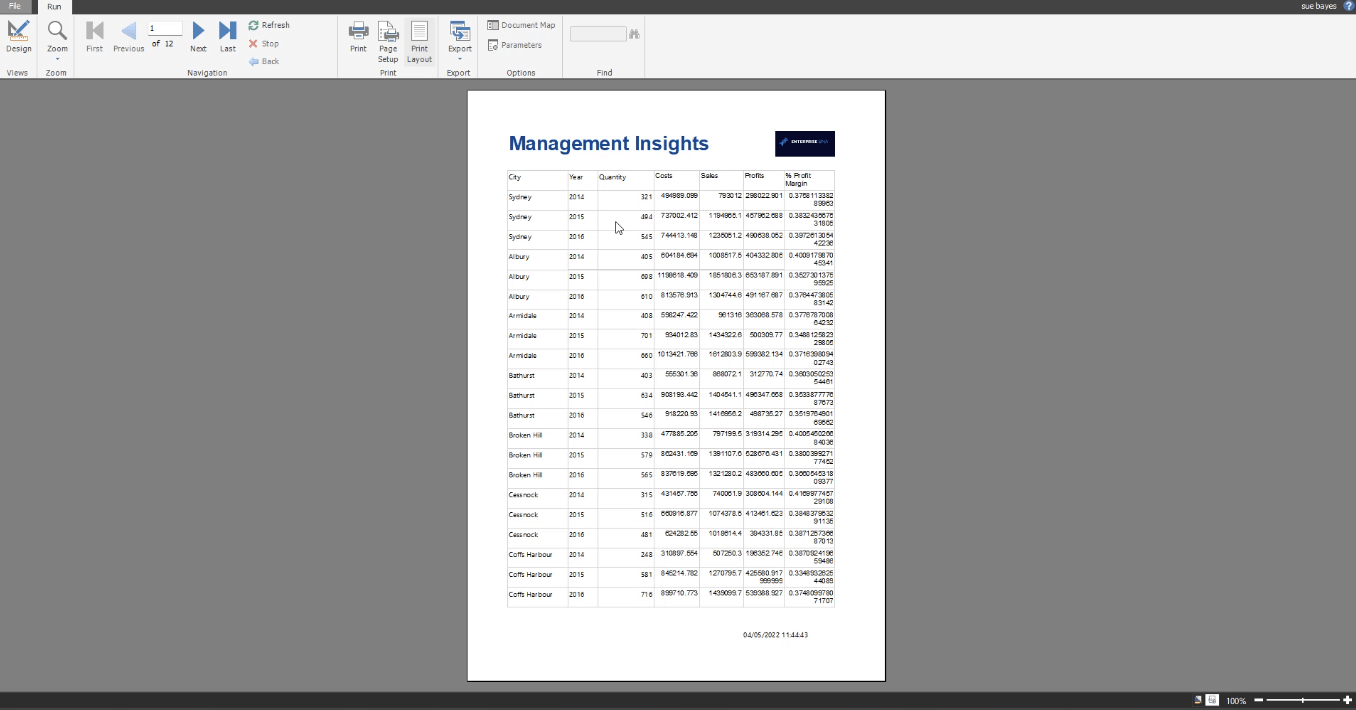
If you run your edited table, you can see that it is starting to look better compared to the first rendered version. Notice also that the pages have been reduced from 52 to 24.
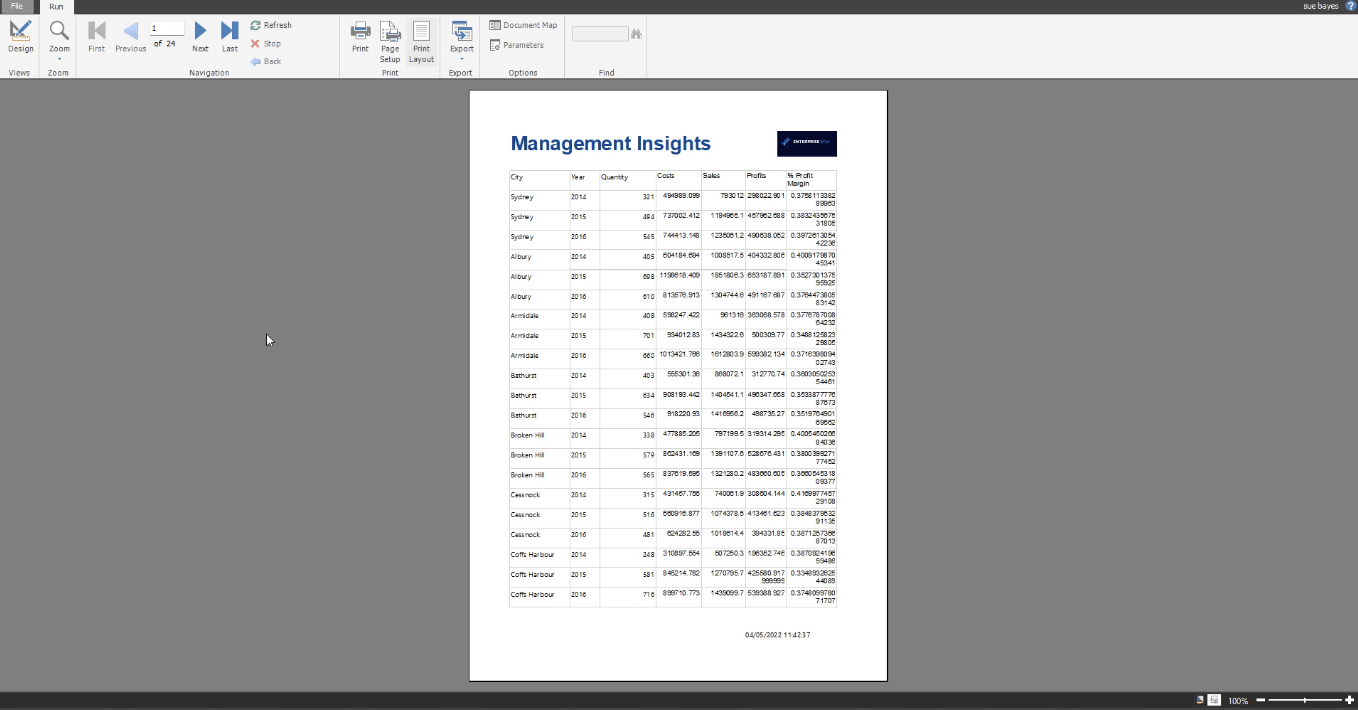
In this example, the next page is a blank page. The current paginated report is composed of blanks in between each page with rows.
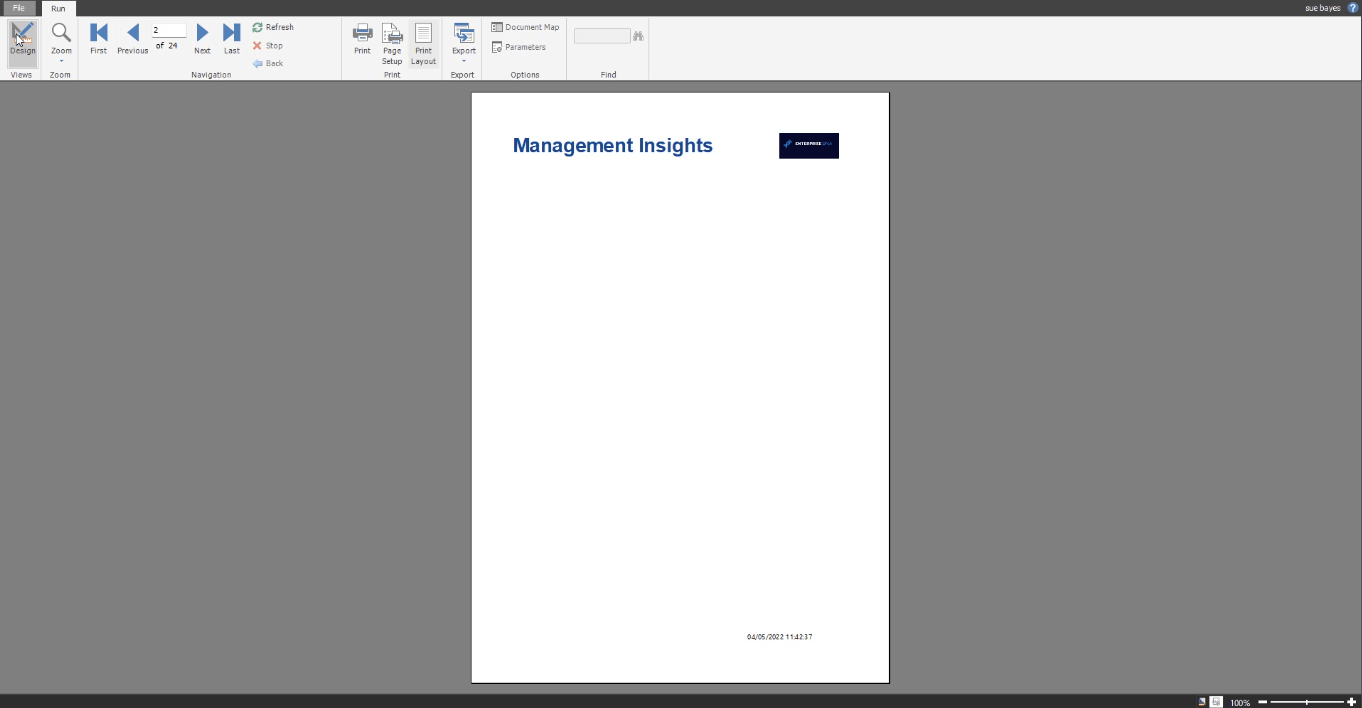
This is because of the blank space in your design canvas. To remove the blank pages, resize the canvas or pull up the border limit.
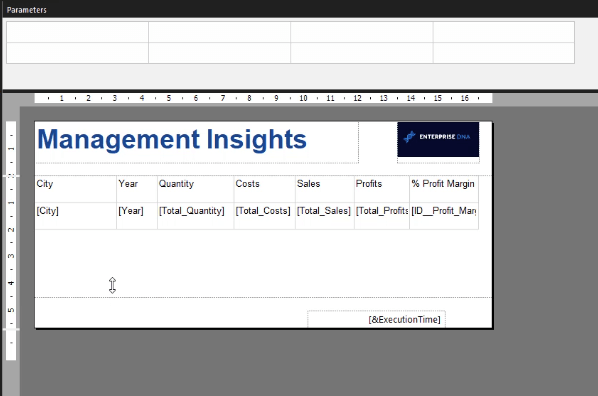
If you run the table again, you can see that from 24 pages, it has now been reduced to 12.
Report Builder Tutorial Step 3: Adjusting Page Margins
In this example, Report Builder automatically adds 0.07 to the margins of the report page if A4 paper size is used. You can view this by clicking the Page Setup button.
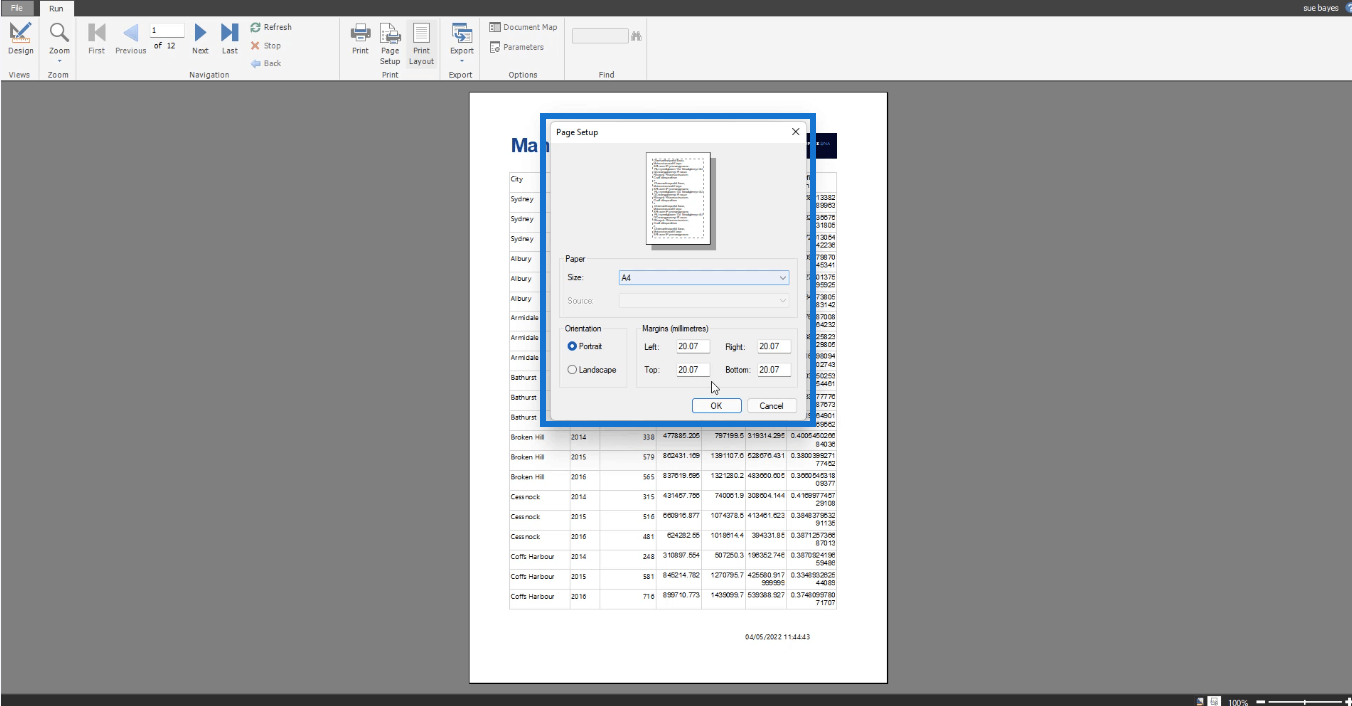
This is NOT true for ALL Report Builder software. However, some users have been experiencing this with their versions.
If you experience the same issue, go back to your design canvas and click it. This will show the Body options of the Properties pane. Adjust the size so that it will accommodate any increases.

Conclusion
Adding a table in Report Builder is a convenient and straightforward process. The ability to drag and drop data from your database, instead of manually typing each one, hastens report development.
Report Builder is a powerful tool when creating . There are more useful features to explore in Report Builder when you dive further into our course on Paginated Reports.
Sue
Excel hücrelerini metne sığdırmak için güncel bilgileri ve 4 kolay çözümü keşfedin.
Bir Excel Dosyasının Boyutunu Küçültmek için 6 Etkili Yöntem. Hızlı ve kolay yöntemler ile verilerinizi kaybetmeden yer açın.
Python'da Self Nedir: Gerçek Dünyadan Örnekler
R'de bir .rds dosyasındaki nesneleri nasıl kaydedeceğinizi ve yükleyeceğinizi öğreneceksiniz. Bu blog aynı zamanda R'den LuckyTemplates'a nesnelerin nasıl içe aktarılacağını da ele alacaktır.
Bu DAX kodlama dili eğitiminde, GENERATE işlevinin nasıl kullanılacağını ve bir ölçü başlığının dinamik olarak nasıl değiştirileceğini öğrenin.
Bu eğitici, raporlarınızdaki dinamik veri görselleştirmelerinden içgörüler oluşturmak için Çok Kanallı Dinamik Görseller tekniğinin nasıl kullanılacağını kapsayacaktır.
Bu yazıda, filtre bağlamından geçeceğim. Filtre bağlamı, herhangi bir LuckyTemplates kullanıcısının başlangıçta öğrenmesi gereken en önemli konulardan biridir.
LuckyTemplates Apps çevrimiçi hizmetinin çeşitli kaynaklardan oluşturulan farklı raporların ve içgörülerin yönetilmesine nasıl yardımcı olabileceğini göstermek istiyorum.
LuckyTemplates'da ölçü dallandırma ve DAX formüllerini birleştirme gibi teknikleri kullanarak kâr marjı değişikliklerinizi nasıl hesaplayacağınızı öğrenin.
Bu öğreticide, veri önbelleklerini gerçekleştirme fikirleri ve bunların DAX'ın sonuç sağlama performansını nasıl etkilediği tartışılacaktır.


