Power Automate si applica a ogni azione nei flussi di lavoro

Scopri l
Microsoft Excel, parte della suite Microsoft Office, è un potente programma per fogli di calcolo introdotto nel 1985 come concorrente del software per fogli di calcolo dominante all'epoca, Lotus 1-2-3.
Nel corso degli anni, Microsoft Excel è diventato il programma software di riferimento per aziende e privati, offrendo un'ampia gamma di funzionalità per l'analisi, la visualizzazione e l'organizzazione dei dati. È ampiamente utilizzato in vari settori, come finanza, marketing, risorse umane e gestione dei progetti, tra gli altri.
Questa guida completa fornirà uno sguardo approfondito alle caratteristiche e alle funzioni di Microsoft Excel, dalle operazioni di base alle funzionalità avanzate, come la creazione di grafici, tabelle pivot e macro. Includeremo anche suggerimenti e risorse per padroneggiare Excel e migliorare la produttività. È sbagliato dire: "È ora che eccelli in Excel"?
Ad ogni modo, iniziamo!
Sommario
Introduzione a Microsoft Excel
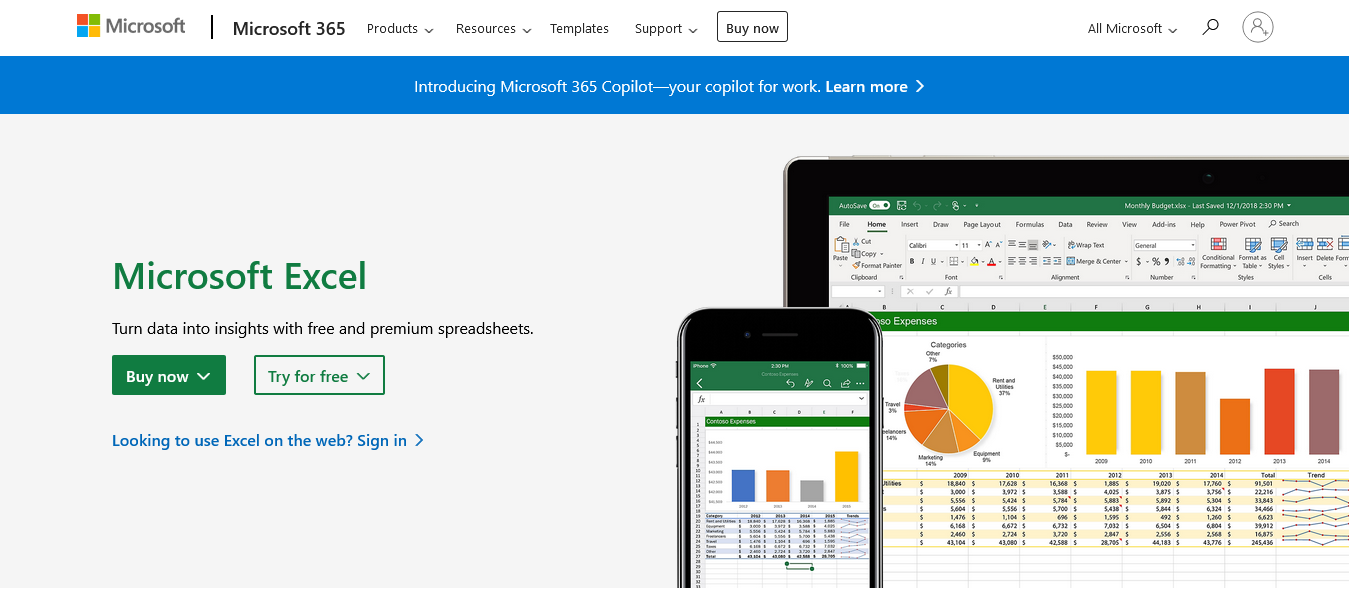
Per iniziare con Microsoft Excel, devi prima scaricare e installare il programma sul tuo computer.
Microsoft Excel può essere installato come parte della suite Microsoft Office o come applicazione autonoma. Puoi acquistare un abbonamento a Office 365 o una licenza una tantum per Office 2019. Per installare Excel, segui i passaggi forniti sul sito Web ufficiale di Microsoft Office .
Dopo aver installato Excel, apri il programma facendo doppio clic sulla sua icona sul desktop o cercandolo nel menu Start (Windows) o Launchpad (macOS).
Versioni e disponibilità di Excel
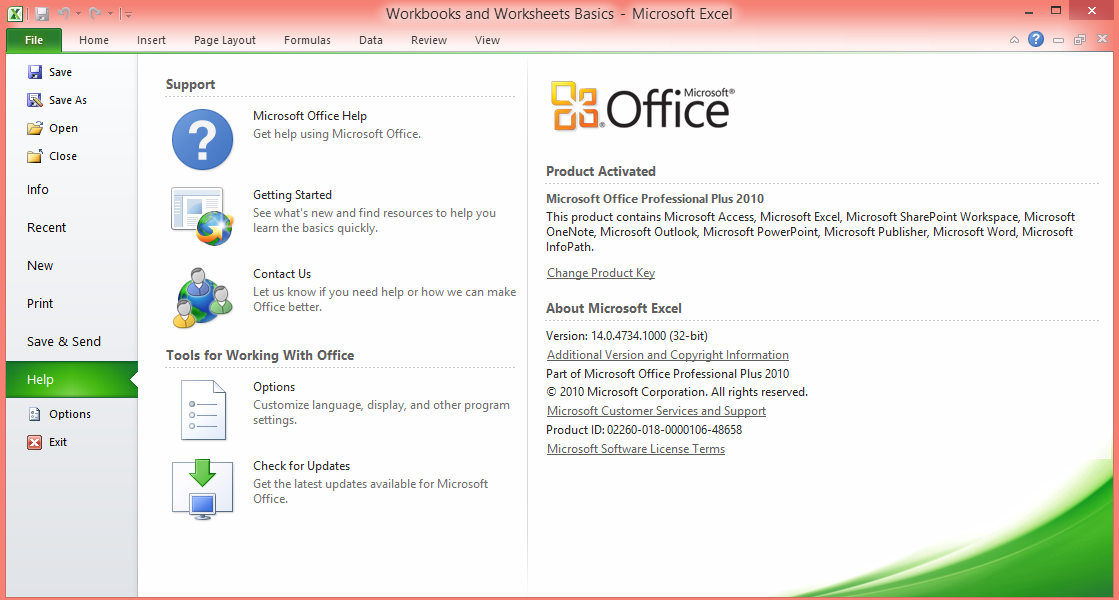
Microsoft Excel si è evoluto nel corso degli anni per soddisfare le esigenze degli utenti in un panorama tecnologico in rapida evoluzione. Oggi sono disponibili diverse versioni del programma per fogli di calcolo su varie piattaforme, tra cui desktop, online e mobile, che offrono agli utenti la flessibilità di accedere e lavorare con i propri dati ovunque e in qualsiasi momento.
In questa sezione forniremo una panoramica delle diverse versioni di Excel e della loro disponibilità, evidenziando le caratteristiche principali e le differenze tra di esse.
Iniziamo con la versione desktop.
Versione desktop
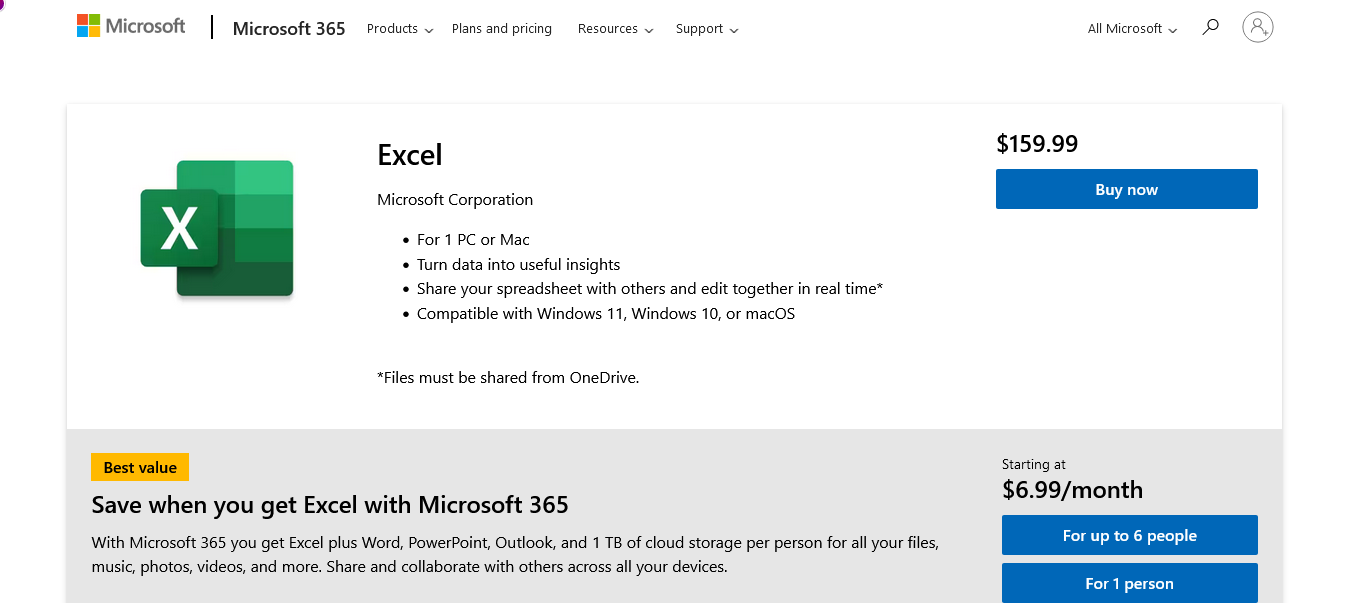
La versione desktop di Microsoft Excel è la tradizionale applicazione ricca di funzionalità installata su computer Windows e macOS. Offre il set più completo di strumenti e funzioni per l'analisi, la visualizzazione e l'automazione dei dati.
È disponibile tramite l'abbonamento a Microsoft 365 o come prodotto autonomo, con aggiornamenti e miglioramenti regolari per migliorare le prestazioni e aggiungere nuove funzionalità.
Lo troverai disponibile su:
Microsoft Windows : Excel per Microsoft Windows è la versione più utilizzata e offre la gamma più ampia di funzionalità e capacità.
macOS : Excel per macOS offre funzionalità simili alla versione Windows, con alcune differenze nelle scorciatoie da tastiera, nel layout e nelle funzionalità specifiche.
Non vuoi scaricare nulla, lo capiamo, la versione web è ciò di cui hai bisogno.
Versione web
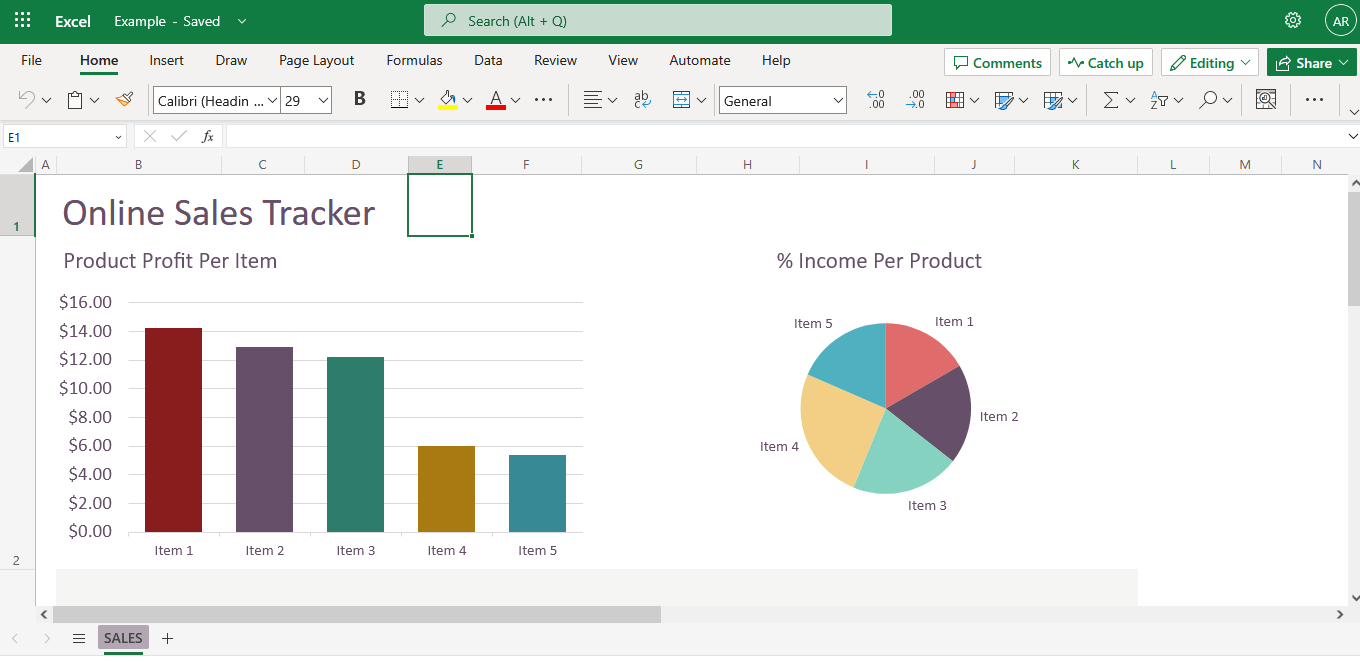
Per gli utenti che cercano una soluzione basata su cloud o per coloro che non hanno accesso alla versione desktop completa, la versione Web di Microsoft Excel è disponibile come parte di Microsoft 365. MS Excel Online è una versione Web di Excel accessibile tramite un browser Web, che consente agli utenti di creare, modificare e condividere fogli di calcolo senza installare alcun software.
Sebbene manchi di alcune funzionalità avanzate presenti nella versione desktop, MS Excel Online è in continuo miglioramento e fornisce collaborazione in tempo reale, rendendolo una soluzione ideale per progetti basati su team.
Ora, diamo un'occhiata alla versione mobile.
Versione mobile

Le app mobili Microsoft Excel sono disponibili per dispositivi iOS e Android e consentono agli utenti di visualizzare, modificare e creare fogli di calcolo Excel sui propri smartphone e tablet.
Sebbene le versioni mobili offrano un set di funzionalità più limitato rispetto alla versione desktop, forniscono funzionalità essenziali per lavorare con i dati in movimento. Inoltre, possono essere sincronizzati senza problemi con altre versioni di MS Excel tramite servizi di archiviazione cloud come OneDrive.
Le varie versioni di Microsoft Excel soddisfano le diverse esigenze e preferenze degli utenti, offrendo flessibilità nel modo in cui lavori con i tuoi dati. Sia che tu preferisca la piena funzionalità della versione desktop, le capacità collaborative di MS Excel Online o la praticità delle app per dispositivi mobili, esiste una versione di Excel su misura per le tue esigenze.
Bene, a meno che tu non sia un tipo di persona di Fogli Google 🙂
Nella sezione successiva di questa guida, imparerai di più sull'interfaccia di MS Excel e sulle sue funzionalità, consentendoti di sfruttare al meglio questo strumento versatile su tutte le piattaforme.
Let’s get into it.
The Excel Interface Explained
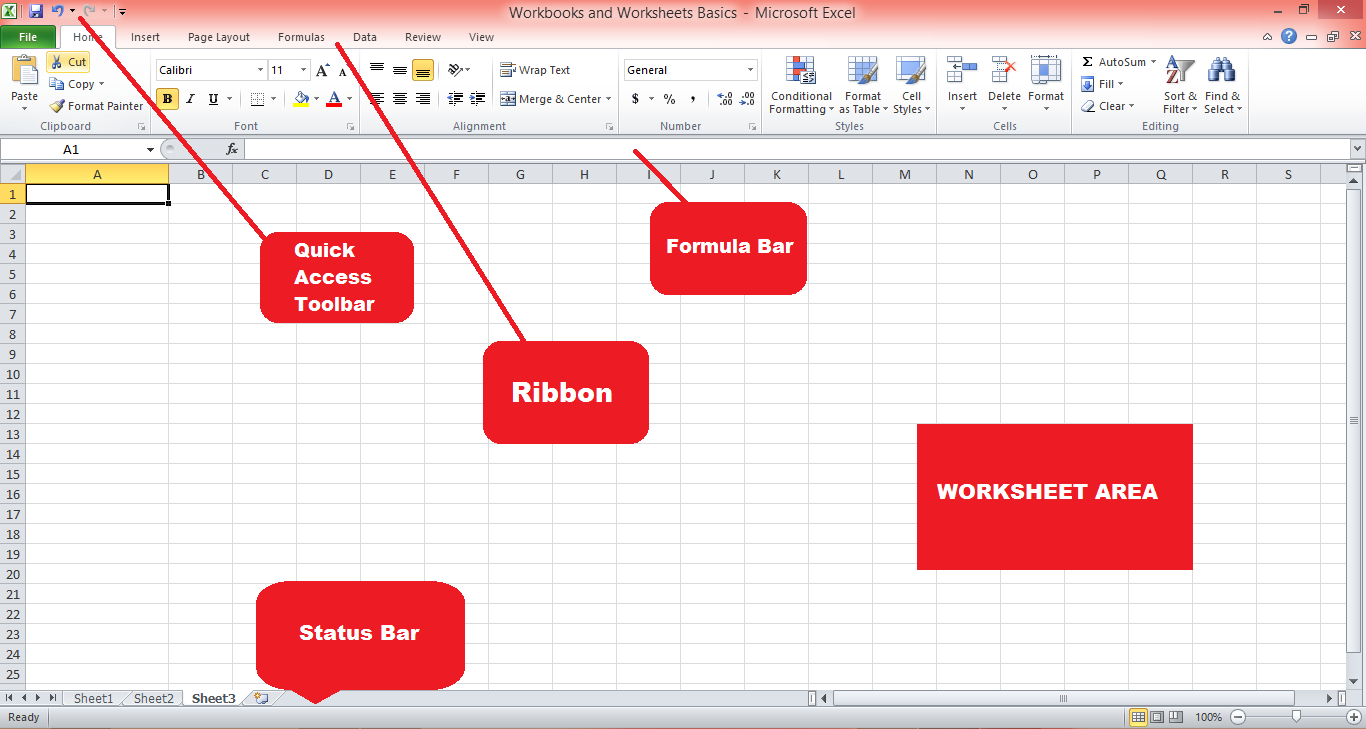
Microsoft Excel’s interface is designed to be user-friendly and intuitive. Key components of the interface include:
Ribbon: The Ribbon is a toolbar located at the top of the Excel window, containing various tabs (Home, Insert, Page Layout, etc.) that group related commands and features. You can customize the Ribbon by adding or removing tabs, groups, and commands.
Quick Access Toolbar: Located above the Ribbon, the Quick Access Toolbar provides shortcuts to frequently used commands, such as Save, Undo, and Redo. You can customize the Quick Access Toolbar by adding or removing commands.
Formula Bar: The Formula Bar, located below the Ribbon, displays the content of the active cell and allows you to edit formulas, text, calculate data, and more.
Worksheet Area: The Worksheet Area, the main working area in MS Excel, contains cells organized in rows and columns. Each cell can store data, such as text, numbers, or formulas.
Status Bar: Located at the bottom of the MS Excel window, the Status Bar provides information about the current worksheet, such as the number of selected cells, the average or sum of selected values, and the current mode (Ready, Edit, or Enter).
In the next section, we take a look at MS Excel workbooks and Excel spreadsheets and how you can effectively use them.
Understanding Workbooks and Worksheets
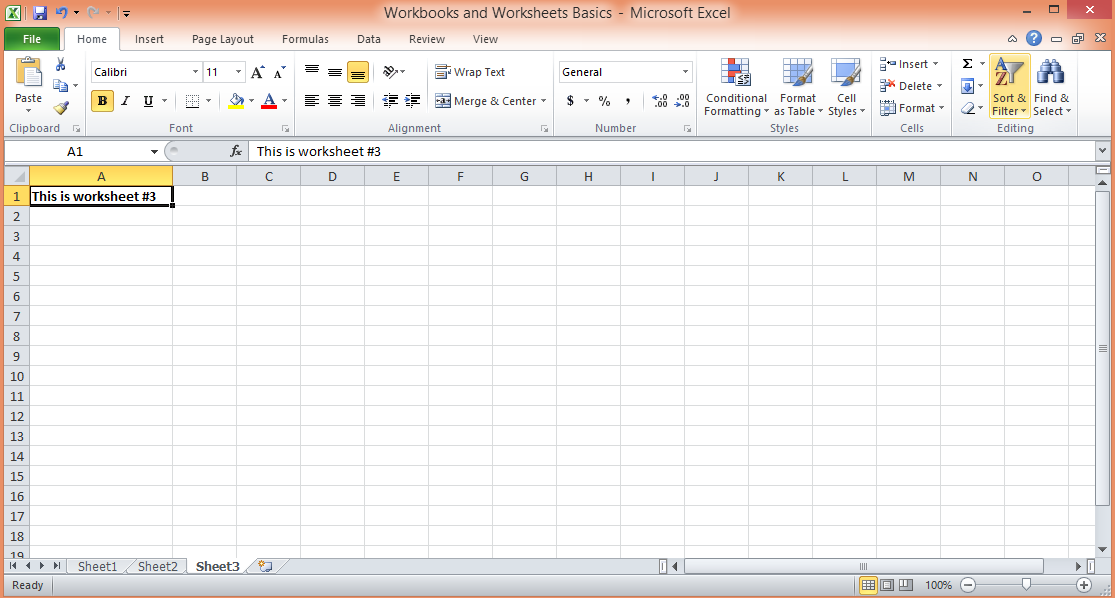
There are two fundamental building blocks of Excel: workbooks and worksheets.
A workbook is an Excel file that can store and organize multiple related worksheets. It has a file extension of .xlsx, .xls, or .xlsm, depending on the version of MS Excel and whether it contains macros. Workbooks allow you to keep related data together, making it easy to navigate, analyze, and maintain your information. You can think of a workbook as a binder that contains different sheets, each holding a separate set of data.
A worksheet, on the other hand, is an individual sheet or page within a workbook. Each worksheet is a grid of cells organized in rows (numbered) and columns (lettered), where you can enter, manipulate, and analyze data. By default, a new Excel workbook contains one worksheet, but you can add, remove, or rename worksheets as needed. Worksheets can be used to store different types of data, perform calculations, or create charts and visualizations.
Understanding how workbooks and worksheets function, as well as how to navigate and manage them efficiently, is essential for effectively organizing and working with your data.
This section will provide an overview of how to create and manage workbooks and worksheets, their features, and best practices for utilizing them in Microsoft Excel.
1. Creating and managing workbooks
To create a new Excel workbook, open up your version of the spreadsheet program and click “File” > “New” > “Blank workbook” or use the keyboard shortcut “Ctrl + N” (Windows) or “Cmd + N” (macOS).
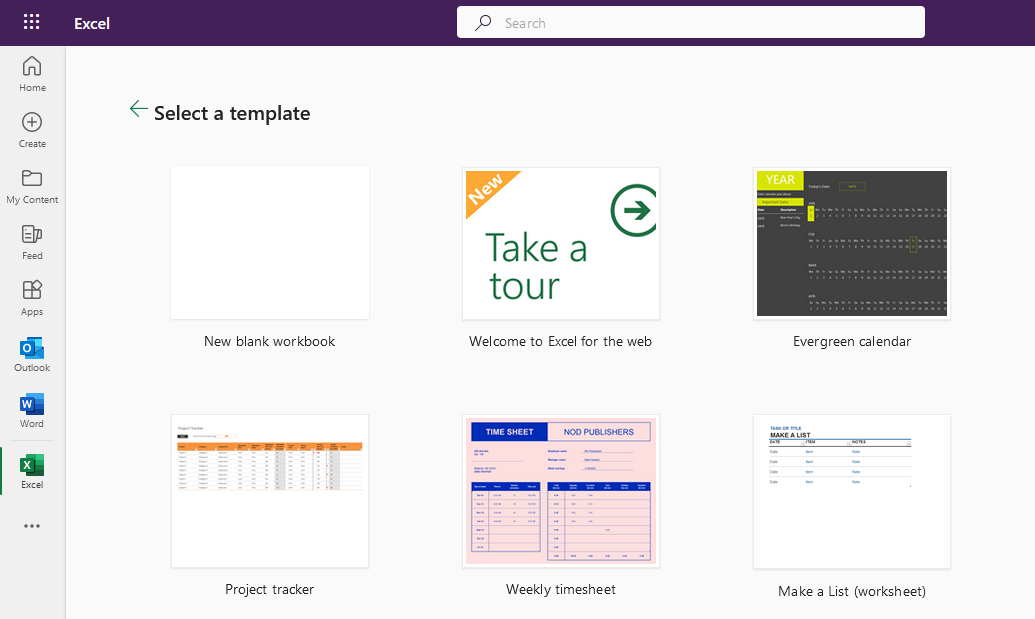
You can also create a workbook based on a template by selecting one from the available options. To open an existing workbook, click “File” > “Open” and browse to the location of your Excel files.
2. Adding, renaming, and deleting worksheets
By default, a new workbook contains one worksheet. To add a new Excel worksheet, click the “+” icon next to the last worksheet tab, right-click an existing worksheet tab and select “Insert,” or use the keyboard shortcut “Shift + F11.”
To rename a worksheet, double-click the worksheet tab, type the new name, and press “Enter.” To delete a worksheet, right-click the worksheet tab and select “Delete.”
3. Navigating between worksheets
To move between worksheets, click the desired worksheet tab or use the keyboard shortcuts “Ctrl + Page Up” (previous worksheet) and “Ctrl + Page Down” (next worksheet) on Windows, or “Option + Left arrow” (previous worksheet) and “Option + Right arrow” (next worksheet) on macOS.
4. Grouping and ungrouping worksheets
Grouping worksheets allow you to perform actions on multiple worksheets simultaneously. To group worksheets, click the first worksheet tab, hold “Shift” or “Ctrl” (Windows) or “Shift” or “Cmd” (macOS), and click the other worksheet tabs you want to group. To ungroup worksheets, right-click any worksheet tab and select “Ungroup Sheets.”
In the next section, we take a look at how you can work with cells, columns, and rows in an Excel spreadsheet.
Working with Cells, Rows, and Columns
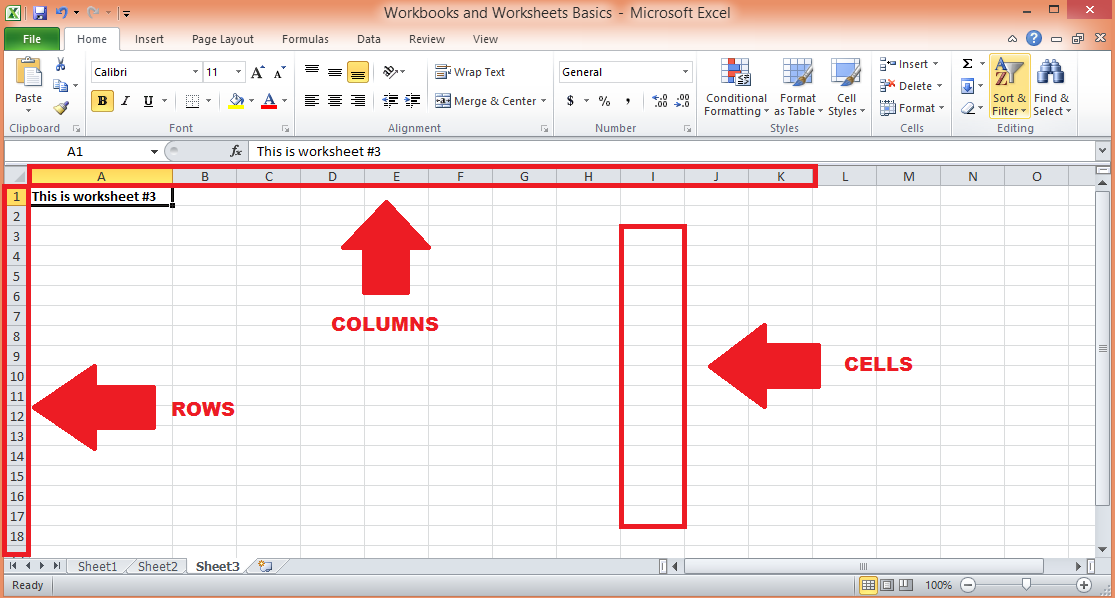
This section focuses on the core elements of Excel spreadsheets’ grid-like structure: cells, rows, and columns. Mastering the art of working with these components is crucial for managing and manipulating data within Excel files effectively.
We will discuss various techniques for selecting, editing, and formatting cells, rows, and columns, as well as tips for optimizing your workflow when working with these fundamental building blocks.
1. Selecting cells, rows, and columns
Click a cell to select it or click and drag to select multiple cells. To select an entire row or column, click the row number or column letter. To select multiple rows or columns, click and drag the row numbers or column letters. Use “Ctrl + A” (Windows) or “Cmd + A” (macOS) to select the entire worksheet.
2. Inserting and deleting rows and columns
To insert a row or column, right-click the row number or column letter and select “Insert.” To delete a row or column, right-click the row number or column letter and select “Delete.”
3. Adjusting row height and column width
To adjust row height or column width, click and drag the border of the row number or column letter. To autofit row height or column width based on the content, double-click the border. Check out this guide for more information.
4. Formatting cells
Formatting data in a Microsoft Excel spreadsheet is important because it helps to make your data more readable and understandable.
Spreadsheet cells can store different types of data, such as text, numbers, or dates, and MS Excel provides various formatting options to improve the appearance and readability of your data, such as:
Number formats: To change the number format (e.g., currency, percentage, date), select the cells and choose the desired format from the “Number” group on the “Home” tab.
Text alignment: To align text within cells, select the cells and choose the desired alignment option (left, center, right, top, middle, bottom) from the “Alignment” group on the “Home” tab.
Borders and shading: To apply borders or shading to cells, select the cells, click the “Border” or “Fill” button in the “Font” group on the “Home” tab, and choose the desired option.
5. Using cell styles and conditional formatting
Cell styles are predefined formatting options that can be applied to cells to visually organize and emphasize data. Conditional formatting allows you to apply formatting based on specific conditions, such as highlighting the highest or lowest values in a range. To apply cell styles or conditional formatting, select the cells, click the “Cell Styles” or “Conditional Formatting” button in the “Styles” group on the “Home” tab, and choose the desired option.
Now that you’re familiar with workbooks and worksheets and how to manage cells, rows, and columns, let’s take a look at some basic and a few advanced Microsoft Excel functions.
Let’s start with the basics.
What Are The Basic Microsoft Excel Functions?
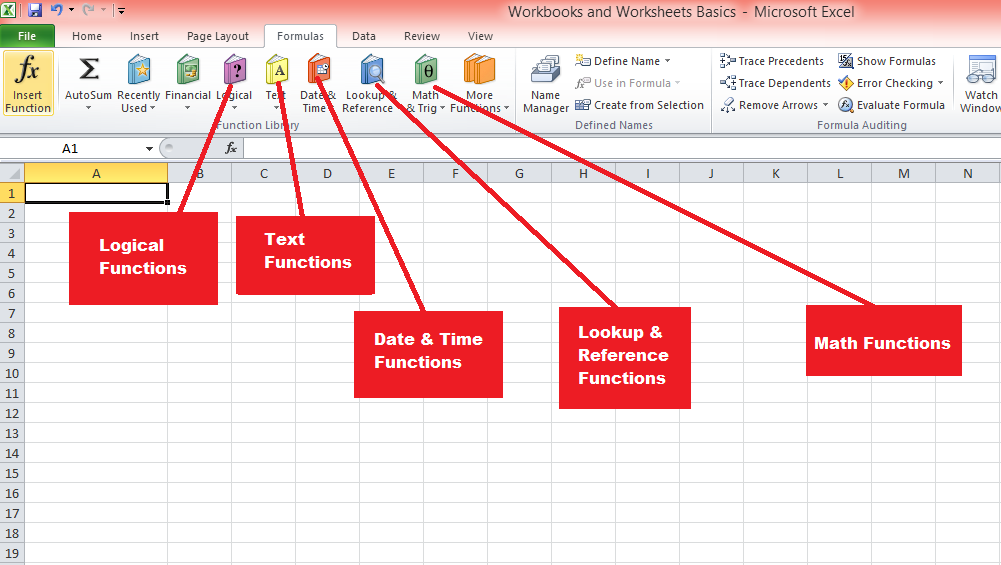
Excel provides a wide range of built-in functions to perform calculations and manipulate data. Functions can be categorized into various types, such as arithmetic, text, date and time, and logical functions.
Let’s explore some of the most important ones.
1. Arithmetic operations
Excel offers basic arithmetic functions like SUM, AVERAGE, MIN, MAX, and COUNT, among others. To use a function, type “=” in a cell, followed by the function name and its arguments in parentheses. For example, “=SUM(A1:A10)” gives the sum of the contents in the range A1 to A10.
2. Text functions
Text functions, such as CONCATENATE, LEFT, RIGHT, MID, LEN, and TRIM, help manipulate and analyze text data. For example, “=CONCATENATE(A1, ” “, B1)” combines the text from cells A1 and B1 with a space in between.
3. Date and time functions
Date and time functions, such as TODAY, NOW, DATE, TIME, YEAR, MONTH, and DAY, allow you to work with date and time data. For example, “=DATEDIF(A1, TODAY(), “Y”)” calculates the number of years between the date in cell A1 and today.
4. Logical functions
Logical functions, such as IF, AND, OR, and NOT, enable decision-making based on specific conditions. For example, “=IF(A1>100, “High”, “Low”)” is an if function that returns “High” if the value in cell A1 is greater than 100 and “Low” otherwise.
5. Lookup and reference functions
Lookup and reference functions, such as VLOOKUP, HLOOKUP, INDEX, and MATCH, help you find and retrieve data from a table or range. For example, “=VLOOKUP(A1, B1:C10, 2, FALSE)” searches for the value in cell A1 within the first column of the range B1:C10 and returns the corresponding value from the second column.
The next section covers more advanced Excel functions, which have a learning curve and may need some practice to properly master, so yourself strap in!
What Are Some Advanced Microsoft Excel Functions?
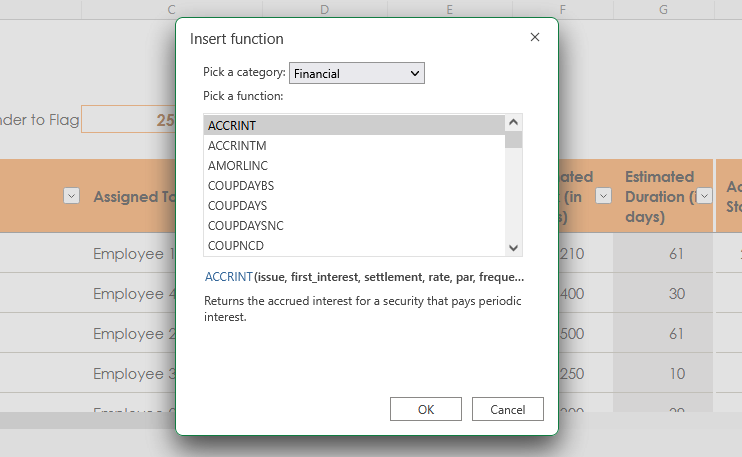
As you progress in your Excel journey, harnessing the power of advanced Excel functions becomes essential for tackling complex data analysis and problem-solving tasks.
In this section, we will explore some of the most powerful and versatile advanced functions that Excel has to offer.
By understanding and applying these functions, you will elevate your data manipulation capabilities, streamline your workflow, and unlock new possibilities for extracting valuable insights from your data.
1. Statistical functions
Statistical functions, such as AVERAGEIF, STDEV, CORREL, and FORECAST, perform statistical analysis on data sets. For example, “=AVERAGEIF(A1:A10, “>100″)” calculates the average of the values in the range A1:A10 that are greater than 100.
2. Financial functions
Financial functions, such as PMT, FV, NPV, and IRR, enable complex financial calculations, including loan payments, future value, net present value, and internal rate of return. For example, “=PMT(0.05/12, 360, -100000)” calculates the monthly payment for a 30-year loan of $100,000 with an annual interest rate of 5%.
3. Array formulas and functions
Array formulas and functions, such as TRANSPOSE, MMULT, and FREQUENCY, perform calculations on arrays of data. To create an array formula, type the formula in a cell, select the desired range, and press “Ctrl + Shift + Enter” (Windows) or “Cmd + Shift + Enter” (macOS).
4. Database functions
Database functions, such as DSUM, DAVERAGE, and DCOUNT, perform calculations on data stored in Excel tables or databases. For example, “=DSUM(A1:C10, “Amount”, E1:F2)” calculates the sum of the “Amount” column in the range A1:C10, based on the criteria specified in the range E1:F2.
Next, we take a look at how you can create and manage tables in Excel, which give a structured way to organize, analyze, and manipulate data. Tables offer several benefits, such as automatic formatting, easier data entry, and dynamic ranges.
How to Create and Manage Tables with Excel
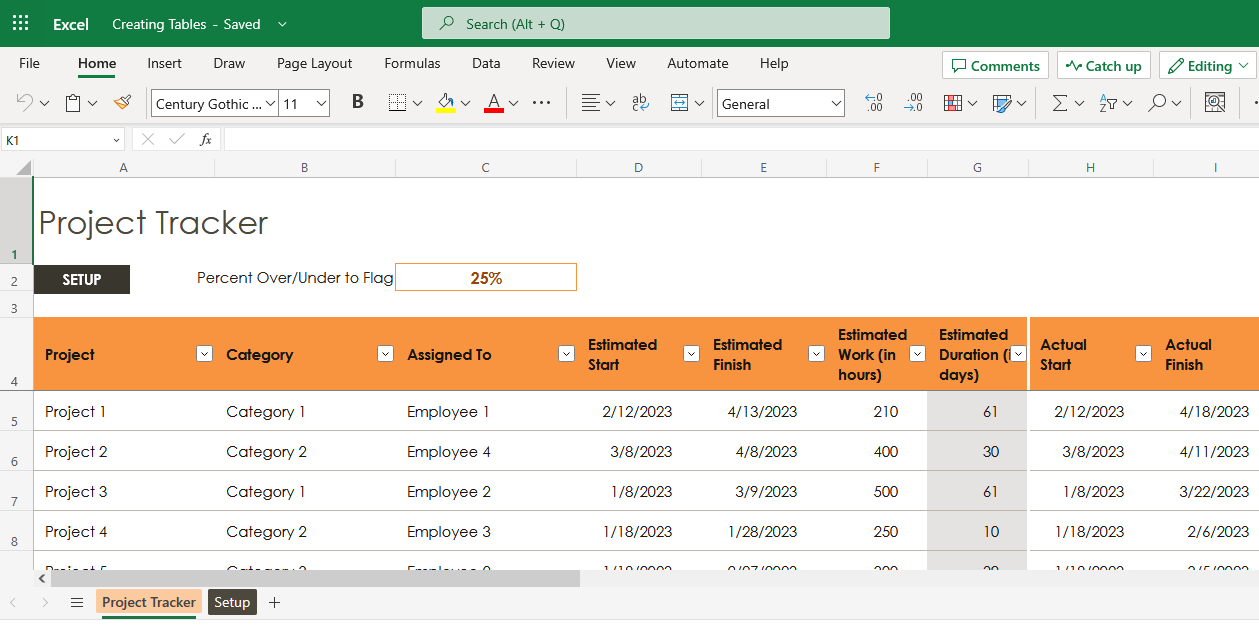
This section examines the process of creating and managing Excel tables, a powerful and flexible feature that simplifies data organization and analysis. Excel tables provide a structured format for your data, along with enhanced functionality for sorting, filtering, and formatting.
By learning how to create and effectively manage Excel tables, you can optimize your data handling and analysis, ensuring a more efficient and streamlined approach to working with your data sets.
1. Creating tables
To create a table, select the range of data, click “Table” in the “Tables” group on the “Insert” tab, and choose “New Table” or use the keyboard shortcut “Ctrl + T” (Windows) or “Cmd + T” (macOS).
2. Sorting and filtering data
Sorting and filtering data in a table can help you quickly find and analyze specific information. To sort data, click the drop-down arrow in the column header and choose the desired sort order (ascending or descending). To filter data, click the drop-down arrow in the column header, check or uncheck the values you want to display, and click “OK.”
3. Using slicers and timelines
Slicers and timelines provide a visual way to filter and arrange data together in a table. To insert a slicer, click the table, click “Slicer” in the “Sort & Filter” group on the “Table Design” tab, and choose the desired column. To insert a timeline, click the table, click “Timeline” in the “Sort & Filter” group on the “Table Design” tab, and choose the desired date column.
4. Data validation and data entry forms
Data validation helps ensure that data entered into a table meets specific criteria, such as a specific range of numbers or a list of allowed values. To apply data validation, select the cells, click “Data Validation” in the “Data Tools” group on the “Data” tab, and choose the desired validation criteria.
Data entry forms provide a user-friendly way to enter data into a table. To create a data entry form, click the table, click “Form” in the “Data Tools” group on the “Data” tab, and enter the data in the form.
5. Removing duplicates
To remove duplicate rows from a table, click the table, click “Remove Duplicates” in the “Data Tools” group on the “Table Design” tab, and choose the table array and columns to compare for duplicates.
What Are Excel Charts and Visualizations?
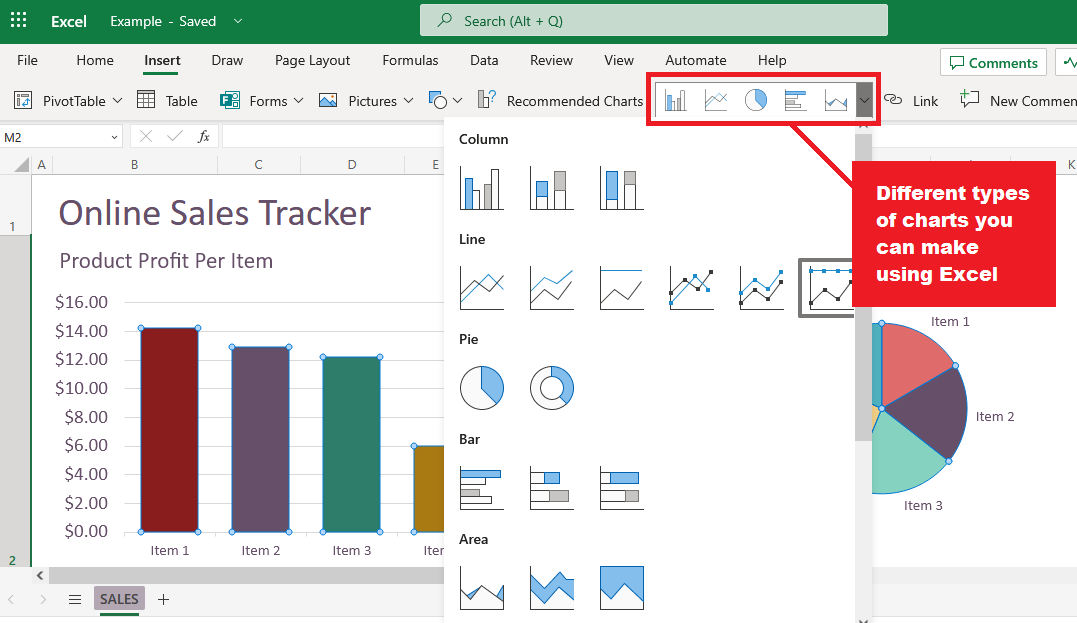
Let’s delve into the world of Excel charts and visualization, an essential aspect of effectively presenting and communicating data insights. Excel offers a wide range of chart types and visualization tools that enable you to transform raw data into meaningful and visually appealing representations.
By mastering the art of creating and customizing Excel charts, you can bring your data to life, making it easier to understand, analyze, and share with your audience.
1. Types of charts
Excel offers numerous chart types to suit different data visualization needs, including:
Column and bar charts: Display data using vertical or horizontal bars, useful for comparing values across categories.
Line and area charts: Display data using lines or filled areas, useful for showing trends over time.
Pie and doughnut charts: Display data using segments of a circle, useful for showing the proportions of a whole.
Scatter and bubble charts: Display data using points or bubbles, useful for showing relationships between two or three variables.
Histograms and box plots: Display data using bars or boxes, useful for showing frequency distributions or statistical summaries.
2. Creating and modifying charts
To create a chart, select the data, click “Insert” > “Charts” and choose the desired chart type, or use the recommended charts feature for suggestions. To modify a chart, click the chart to display the “Chart Design” and “Format” tabs, which provide various options for customizing the chart’s appearance, layout, and data.
3. Using Sparklines
Sparklines are miniature charts that fit within a single cell, useful for showing trends or variations in data within a row. To create a sparkline, select the cell where you want to insert the sparkline, click “Insert” > “Sparklines,” choose the desired sparkline type (Line, Column, or Win/Loss), and specify the data range.
4. Conditional formatting with icon sets and data bars
Conditional formatting in Excel allows you to apply specific formatting, such as colors or icons, to cells based on their values or specific conditions. Icon sets and data bars are two types of conditional formatting that can help you visually represent data, making it easier to identify trends, patterns, or outliers.
a) Icon sets
Icon sets are a group of icons that can be applied to cells based on specified criteria. Excel provides various icon sets, such as arrows, traffic lights, and flags, to represent different data scenarios.
When you apply an icon set, Excel divides the data into three or more categories and assigns a specific icon to each category.
To apply an icon set:
Select the cells you want to format.
Click “Conditional Formatting” in the “Styles” group on the “Home” tab.
Choose “Icon Sets” and select the desired icon set from the list.
To customize the criteria for each icon, click “Conditional Formatting” > “Manage Rules” > “Edit Rule” and adjust the settings in the “Edit Formatting Rule” dialog box.
b) Data bars
Data bars are horizontal bars that represent the relative value of a cell within a range of cells. Data bars can help you quickly visualize the magnitude of values, making it easy to spot high and low values at a glance.
You can customize the appearance of data bars, such as the color, gradient, and border. To apply data bars:
Select the cells you want to format.
Click “Conditional Formatting” in the “Styles” group on the “Home” tab.
Choose “Data Bars” and select the desired color or gradient fill from the list.
To customize the appearance of data bars or modify the value range, click “Conditional Formatting” > “Manage Rules” > “Edit Rule” and adjust the settings in the “Edit Formatting Rule” dialog box.
By using conditional formatting with icon sets and data bars, you can enhance the visual appeal of your data and make it easier for your audience to understand and analyze the information.
Now, let’s talk about PivotTables and PivotCharts
What Are Excel PivotTables and PivotCharts?
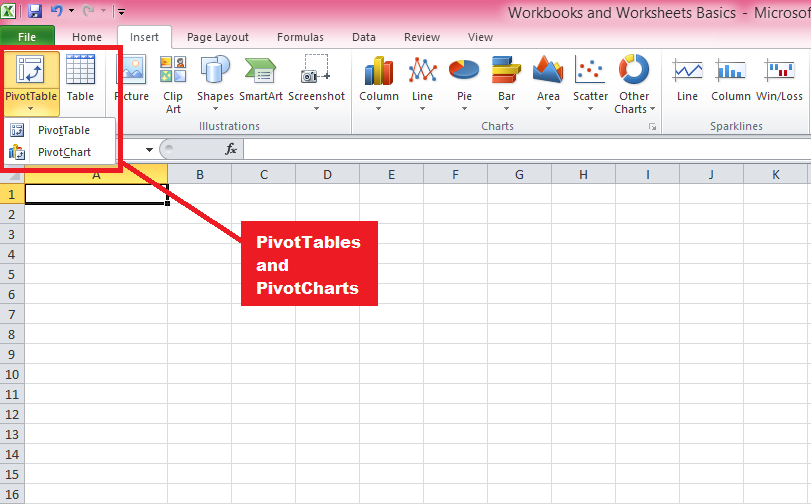
PivotTables and PivotCharts are powerful tools in Excel that enable you to summarize, analyze, and explore large data sets by organizing data in a hierarchical structure and presenting it in a visually appealing manner.
They allow you to manipulate data with simple drag-and-drop actions, making it easy to identify trends, patterns, and relationships within your data.
Let’s first discuss PivotTables
a) PivotTables
PivotTables are a powerful data analysis tool in Excel that allows you to summarize, organize, and explore large volumes of data in a structured, hierarchical format. They can be used to perform a wide range of tasks, such as data aggregation, cross-tabulation, and data filtering.
Below are the steps to follow to create them:
Creating PivotTables: Select the data you want to analyze, then click “Insert” > “PivotTable,” and choose the desired location for the PivotTable. Alternatively, you can use the “Recommended PivotTables” feature for suggestions based on your data.
Arranging and manipulating data in PivotTables: To organize your data, drag fields from the field list to the row, column, value, and filter areas. Change the summary function, apply number formatting, group data, and sort and filter data using various options available in the PivotTable context menus and the “PivotTable Analyze” tab.
Using calculated fields and items: You can perform custom calculations in PivotTables using formulas that reference other fields or items. Click “Formulas” > “Calculated Field” or “Calculated Item” in the “Tools” group on the “PivotTable Analyze” tab, and enter the formula in the “Formula” box.
Aggiornamento e aggiornamento delle tabelle pivot : è necessario aggiornare la tabella pivot per aggiornare i calcoli di riepilogo e visualizzare i dati più recenti quando i dati di origine cambiano. Fai clic su "Aggiorna" nel gruppo "Dati" nella scheda "Analizza tabella pivot" o utilizza la scorciatoia da tastiera "Alt + F5" (Windows) o "Cmd + Opzione + R" (macOS).
b) Grafici pivot
I grafici pivot sono grafici dinamici e interattivi basati su tabelle pivot che consentono di visualizzare relazioni di dati complesse in modo visivamente accattivante.
Ereditano la struttura e le funzionalità di manipolazione dei dati delle tabelle pivot, consentendo di creare, personalizzare ed esplorare diverse visualizzazioni dati modificando il layout, l'aspetto o i calcoli di riepilogo della tabella pivot sottostante.
I grafici pivot sono un ottimo strumento per presentare e analizzare i dati in modo più intuitivo e coinvolgente. Di seguito sono riportati i passaggi per la creazione di grafici pivot
Creazione di grafici pivot: fare clic sulla tabella pivot per la quale si desidera creare un grafico. B. Fai clic su "Grafico pivot" nel gruppo "Strumenti" nella scheda "Analizza tabella pivot" e scegli il tipo di grafico desiderato.
Personalizzazione e interazione con i grafici pivot: utilizzare le schede "Design grafico" e "Formato" per modificare l'aspetto, il layout ei dati del grafico. Utilizza l'elenco dei campi, i filtri dei dati e le sequenze temporali della tabella pivot per interagire con il grafico ed esplorare diverse visualizzazioni dati.
Acquisendo familiarità con le tabelle pivot e i grafici pivot, puoi analizzare e presentare in modo efficiente set di dati complessi e scoprire informazioni preziose. Questi strumenti sono essenziali per chiunque lavori con grandi quantità di dati in Excel, soprattutto quando si tratta di analisi aziendali, finanziarie o statistiche.
Successivamente, diamo uno sguardo all'importanza della collaborazione e della condivisione in Excel e impariamo come condividere efficacemente il tuo lavoro con gli altri, arricchendo ulteriormente la tua esperienza con Excel e ottimizzando il tuo flusso di lavoro.
Come collaborare e condividere file Excel?
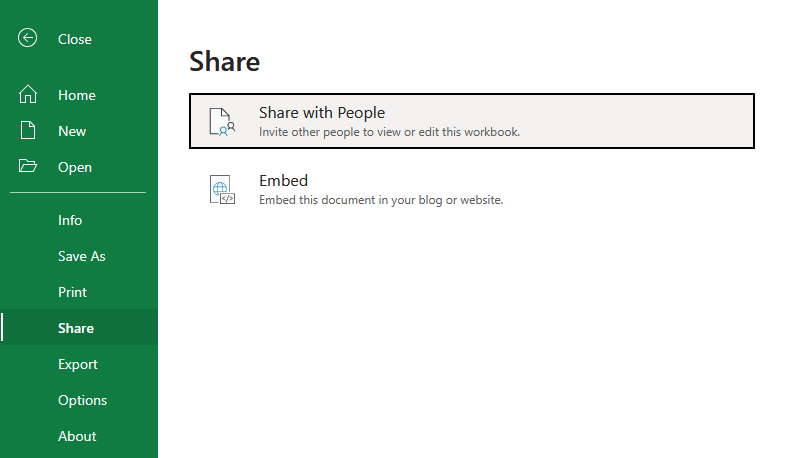
Nel mondo frenetico e interconnesso di oggi, la collaborazione e la condivisione efficaci sono fondamentali per il successo del lavoro di squadra e della gestione dei progetti. Excel offre varie funzionalità e strumenti che consentono agli utenti di collaborare senza problemi e condividere il proprio lavoro con altri.
Questa sezione discuterà alcuni aspetti chiave della collaborazione e della condivisione in Excel, evidenziando le funzionalità essenziali e le procedure consigliate.
1. Collaborazione in tempo reale
Excel supporta la collaborazione in tempo reale, consentendo a più utenti di lavorare contemporaneamente sullo stesso foglio di calcolo o cartella di lavoro. Questa funzionalità è disponibile in Excel per Microsoft 365, Excel Online e nelle app per dispositivi mobili Excel. Per collaborare in tempo reale:
Salva la cartella di lavoro in una posizione condivisa, ad esempio OneDrive o SharePoint.
Condividi la cartella di lavoro con i tuoi collaboratori facendo clic su "Condividi" nell'angolo in alto a destra della finestra di Excel e inserendo i loro indirizzi e-mail o generando un collegamento di condivisione.
I collaboratori possono aprire la cartella di lavoro condivisa e apportare modifiche contemporaneamente, con le modifiche visibili a tutti gli utenti in tempo reale.
2. Co-creazione
La creazione condivisa è parte integrante della collaborazione in tempo reale in Excel e consente agli utenti di lavorare su parti diverse di una cartella di lavoro senza sovrascrivere le modifiche reciproche. Excel unisce automaticamente le modifiche apportate da più utenti, fornendo anche opzioni per rivedere e risolvere i conflitti se si verificano.
3. Cronologia delle versioni
Excel tiene traccia della cronologia delle versioni per le cartelle di lavoro condivise, consentendo agli utenti di visualizzare, ripristinare o confrontare le versioni precedenti di una cartella di lavoro. Per accedere alla cronologia delle versioni:
Fare clic su "File" > "Informazioni" > "Cronologia versioni" in Excel per Microsoft 365 oppure fare clic sul nome del file nella barra del titolo e selezionare "Cronologia versioni" in Excel Online.
Sfoglia l'elenco delle versioni precedenti e fai clic su una versione per aprirla in una finestra separata per la revisione o il confronto.
4. Commenti e @Menzioni
Excel fornisce un sistema di commenti integrato che consente agli utenti di lasciare note, porre domande o fornire feedback su celle o intervalli specifici. Usando le @menzioni, puoi taggare i collaboratori nei commenti, avvisarli e dirigere la loro attenzione su punti specifici della cartella di lavoro. Per aggiungere un commento:
Seleziona la cella o l'intervallo su cui vuoi commentare.
Fare clic su "Revisione" > "Nuovo commento" in Excel per Microsoft 365 o fare clic su "Inserisci" > "Commento" in Excel Online.
Digita il tuo commento e usa @ seguito dal nome o dall'indirizzo email di un collaboratore per menzionarlo.
Le funzionalità di collaborazione e condivisione di Excel consentono agli utenti di collaborare facilmente ai progetti, condividere approfondimenti e semplificare la comunicazione. Sfruttando questi strumenti e le best practice, puoi migliorare la produttività del tuo team e assicurarti che il tuo lavoro sia sempre aggiornato e accessibile a chi ne ha bisogno.
Nella sezione successiva, esaminiamo come espandere ulteriormente le funzionalità di Excel utilizzando i componenti aggiuntivi e la sua capacità di integrazione con vari prodotti Microsoft.
Componenti aggiuntivi di Excel e integrazione con altri prodotti Microsoft
Le funzionalità di Excel possono essere ampliate in modo significativo tramite i componenti aggiuntivi e l'integrazione con altri prodotti Microsoft, consentendo agli utenti di eseguire attività avanzate, automatizzare i processi e migliorare l'analisi e la visualizzazione dei dati.
Questa sezione discuterà alcuni dei componenti aggiuntivi di Excel più popolari e utili, nonché l'integrazione di Excel con altri prodotti Microsoft, come LuckyTemplates , Microsoft Word e altri.
Cosa sono i componenti aggiuntivi di Excel?
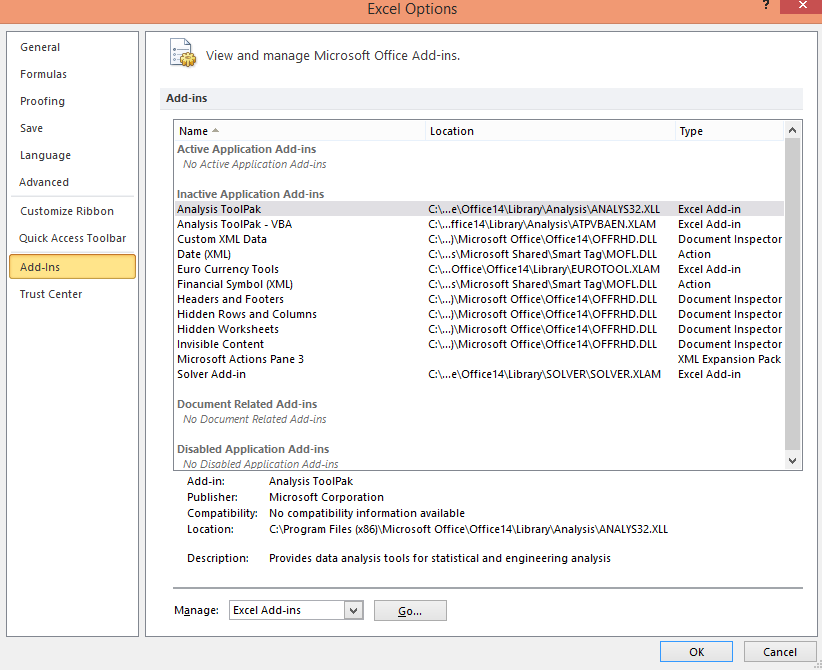
I componenti aggiuntivi sono estensioni o plug-in di terze parti che possono essere installati all'interno di Excel per fornire funzionalità aggiuntive. Sono disponibili numerosi componenti aggiuntivi, che vanno dagli strumenti di analisi dei dati ai potenziatori della produttività.
Alcuni popolari componenti aggiuntivi di Excel includono:
Analysis ToolPak : un componente aggiuntivo integrato di Excel che fornisce strumenti avanzati di analisi statistica, come regressione, correlazione e analisi di serie temporali.
Risolutore : uno strumento di ottimizzazione integrato che aiuta gli utenti a trovare la soluzione ottimale per problemi lineari e non lineari, tra cui l'allocazione delle risorse, la programmazione e la pianificazione finanziaria.
Power Query : un potente strumento di trasformazione e modellazione dei dati che consente agli utenti di connettersi a varie origini dati, pulire e trasformare i dati e caricarli in Excel per ulteriori analisi.
Power Map: uno strumento di visualizzazione di dati 3D che consente agli utenti di creare visualizzazioni geografiche interattive utilizzando dati geospaziali in Excel.
2. Integrazione con i prodotti Microsoft
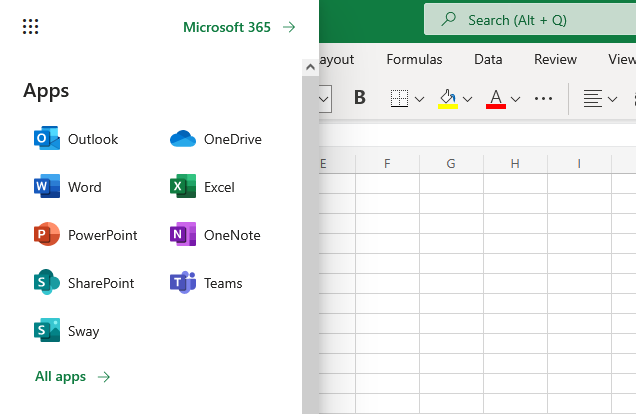
Excel si integra perfettamente con altri prodotti Microsoft, consentendo agli utenti di sfruttare i punti di forza di più strumenti per un flusso di lavoro più completo ed efficiente. Alcune integrazioni chiave includono:
LuckyTemplates: LuckyTemplates è un potente strumento di visualizzazione dei dati e business intelligence che si integra con Excel per creare dashboard e report interattivi in tempo reale. Gli utenti possono connettere LuckyTemplates alle origini dati di Excel, importare modelli di dati di Excel e persino incorporare oggetti di Excel come tabelle pivot e grafici direttamente nei report di LuckyTemplates.
Microsoft Word : Excel si integra con Microsoft Word, consentendo di condividere facilmente i dati tra le due applicazioni. Questa integrazione consente agli utenti di eseguire attività quali l'inserimento di dati, tabelle o grafici in un documento Word o l'utilizzo di Word per creare report formattati basati su dati Excel.
SharePoint : Excel si integra con SharePoint, consentendo agli utenti di archiviare, condividere e collaborare alle cartelle di lavoro di Excel all'interno di un ambiente SharePoint. Questa integrazione facilita il controllo della versione, la gestione degli accessi e la creazione condivisa in tempo reale.
OneDrive: OneDrive consente agli utenti di archiviare e sincronizzare i file Excel nel cloud, rendendoli accessibili da qualsiasi dispositivo e garantendo che le modifiche vengano salvate e sincronizzate automaticamente su tutte le piattaforme.
I componenti aggiuntivi e l'integrazione di Excel con altri prodotti Microsoft migliorano notevolmente le sue capacità e aiutano gli utenti a eseguire attività più avanzate e creare analisi più sofisticate.
Sfruttando questi componenti aggiuntivi e integrazioni, in particolare il potente strumento di visualizzazione dei dati LuckyTemplates, puoi sfruttare tutto il potenziale di Excel e semplificare il tuo flusso di lavoro su più applicazioni Microsoft.
Nella prossima sezione, esploreremo varie applicazioni reali di Microsoft Excel, dimostrando come le caratteristiche e le capacità che abbiamo esplorato finora possono essere utilizzate per affrontare sfide e scenari pratici.
Quali sono le applicazioni del mondo reale di Microsoft Excel?
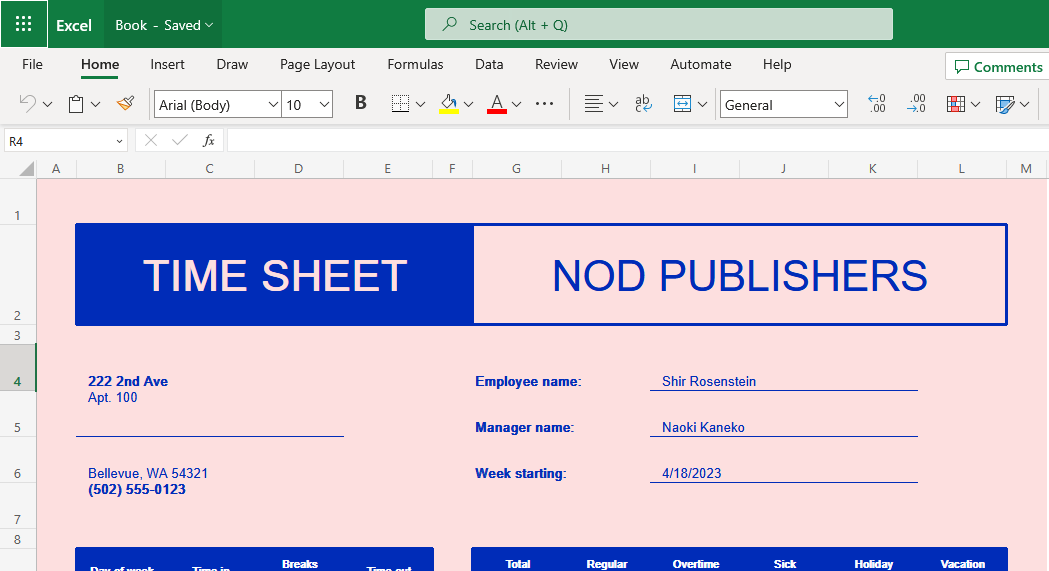
1. Affari e finanza
Microsoft Excel svolge un ruolo fondamentale in vari settori aziendali e finanziari. È comunemente utilizzato per l'analisi dei dati, la tenuta dei registri, il budget e la rendicontazione finanziaria. Excel fornisce un'interfaccia utente grafica intuitiva con funzionalità come formule integrate, funzioni e strumenti di analisi dei dati che consentono agli utenti di prendere decisioni informate in base ai propri dati.
Aziende di tutte le dimensioni utilizzano il programma software per eseguire analisi costi-benefici, analisi finanziarie, tenere traccia delle entrate e delle spese e prevedere le tendenze finanziarie future. Con le sue solide capacità, è diventato uno strumento essenziale nel mondo della finanza, consentendo ai professionisti di creare modelli finanziari, organizzare i dati e garantire un'analisi dei dati accurata ed efficiente.
2. Istruzione
Microsoft Excel è ampiamente utilizzato nelle istituzioni educative per vari scopi. Gli insegnanti utilizzano spesso Excel per organizzare i voti degli studenti, tenere traccia delle presenze e calcolare medie o percentili. Le sue caratteristiche, come gli strumenti grafici e le tabelle pivot, consentono agli educatori di presentare i dati in un modo visivamente più accattivante, facilitando agli studenti la comprensione di concetti complessi.
Gli studenti traggono vantaggio dall'imparare a utilizzare Microsoft Excel per eseguire calcoli, analizzare i risultati e sviluppare capacità di risoluzione dei problemi. Il software è una risorsa inestimabile quando si conducono ricerche o si presentano risultati, rendendolo uno strumento versatile per il lavoro accademico.
3. Produttività personale
Microsoft Excel estende la sua utilità oltre i contesti aziendali ed educativi, poiché le persone spesso fanno affidamento su di esso per scopi di produttività personale. Excel consente alle persone di gestire le proprie finanze personali, creare budget e tenere traccia delle spese con facilità. Con l'ampia gamma di formule di Excel, gli utenti possono eseguire i propri calcoli e analizzare i propri dati in modo efficace.
Inoltre, Microsoft Excel viene utilizzato per la pianificazione degli eventi, come l'organizzazione degli elenchi degli invitati, il monitoraggio degli RSVP e la creazione di tabelle dei posti a sedere. Gli individui utilizzano il software anche per analizzare i dati personali, come le routine di allenamento, la pianificazione dei pasti e le tempistiche dei progetti. La sua versatilità rende Microsoft Excel uno strumento prezioso per migliorare la produttività personale in vari aspetti della vita quotidiana.
La linea di fondo
Microsoft Excel è cresciuto fino a diventare il software per fogli di calcolo più popolare al mondo per una buona ragione. È uno strumento versatile e potente per lavorare con i dati, eseguire calcoli e creare visualizzazioni.
Questa guida completa ha coperto le nozioni di base di Microsoft Excel, tra cui l'interfaccia, l'immissione dei dati, la formattazione, le funzioni di base e avanzate, le tabelle, i grafici, le tabelle pivot, la collaborazione e i componenti aggiuntivi e le integrazioni di Excel.
Comprendendo e padroneggiando queste funzionalità, puoi aumentare la tua efficienza, semplificare il tuo flusso di lavoro e sbloccare tutto il potenziale di Excel per l'analisi e la presentazione dei dati.
Mentre continui a lavorare con Excel, ricorda che sono disponibili molte , esercitazioni e forum per aiutarti ad apprendere funzionalità e tecniche più avanzate.
Più usi Excel, più abile diventerai nella gestione e nell'analisi dei dati, rendendola un'abilità inestimabile nel mondo odierno basato sui dati.
Per saperne di più su Excel e su come usarlo, dai un'occhiata al tutorial qui sotto:
Scopri l
Tecniche di modellazione dei dati per organizzare meglio le misure DAX per un flusso di lavoro più efficiente.
Scopri come utilizzare la funzione di filtro in Power Apps e come incorporarla nelle formule esistenti all
Come commentare più righe in Python: una guida semplice e veloce
Acquisisci familiarità con i connettori Power Automate per la manipolazione di numeri, testo e date/ore.
Ora, è molto facile studiare il budget rispetto all
Imparerai come salvare e caricare oggetti da un file .rds in R. Questo articolo tratta anche come importare oggetti da R a LuckyTemplates.
Scopri tutto su Power Query e il linguaggio M per la trasformazione e la preparazione dei dati nel desktop di LuckyTemplates.
Cos'è il sé in Python: esempi del mondo reale
In questa esercitazione sul linguaggio di codifica DAX, scopri come usare la funzione GENERATE e come modificare dinamicamente il titolo di una misura.


