คู่มือการดาวน์โหลดและติดตั้ง R และ RStudio

ค้นพบวิธีที่เราสามารถดาวน์โหลดและติดตั้ง R และ RStudio ซึ่งเป็นทั้งแบบฟรีและแบบโอเพ่นซอร์สสำหรับการเขียนโปรแกรมสถิติและกราฟิก
ในบทช่วยสอนนี้ ฉันจะพูดถึงวิธีใช้ ฟีเจอร์ Well Known Textในภาพแผนที่ไอคอน LuckyTemplates โพสต์บล็อกนี้จะอธิบายเพิ่มเติมเกี่ยวกับการใช้ LuckyTemplates ในโครงการเชิงพื้นที่
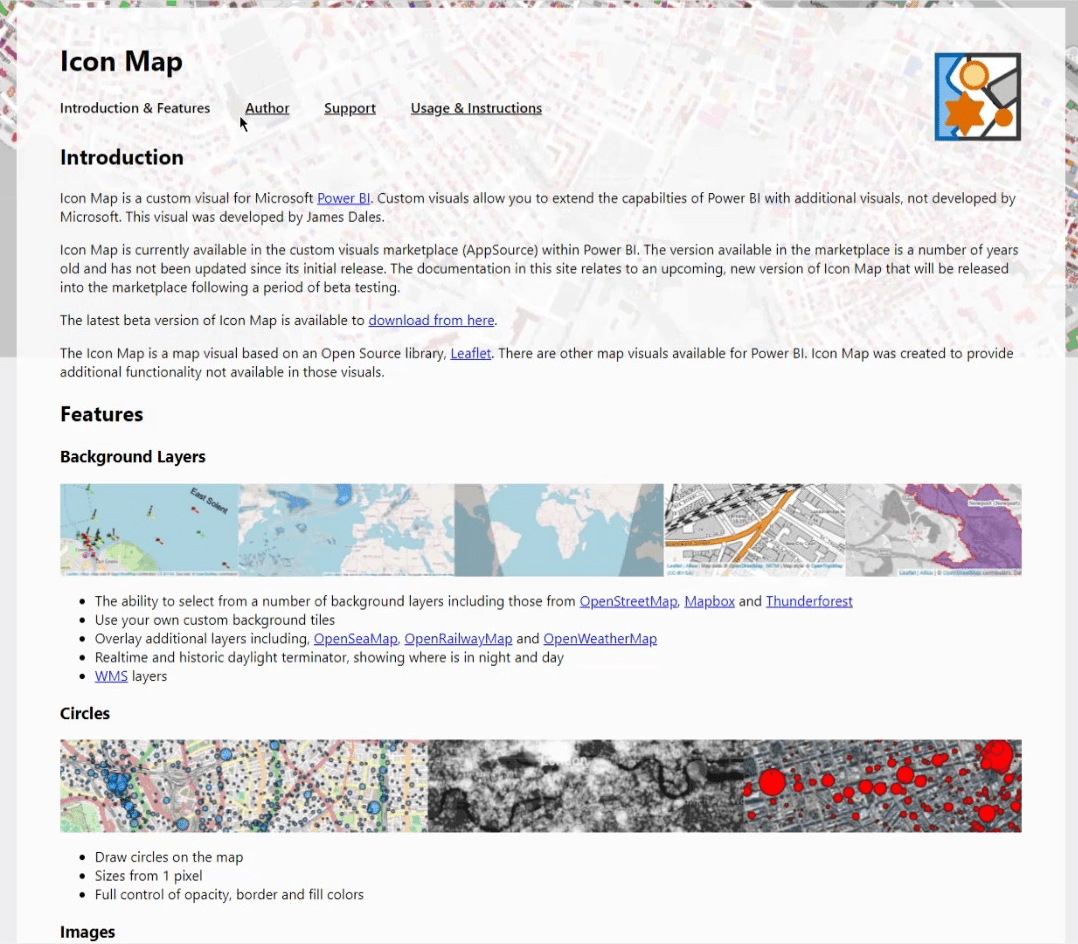
แผนที่ไอคอน LuckyTemplatesเป็นหนึ่งในภาพแผนที่ที่หลากหลายและซับซ้อนที่สุด มีฟังก์ชันการทำงานที่ภาพแผนที่อื่นๆ ยังขาดอยู่ รองรับแผนที่รูปแบบต่างๆ คำแนะนำเครื่องมือ และอ้างความปลอดภัยของข้อมูลที่ดีขึ้น
สำหรับการแสดงภาพและวิเคราะห์การไหล เช่น เส้นทางการจัดส่งหรือท่อส่งก๊าซ ภาพ แผนที่ไอคอนมีข้อได้เปรียบมากมาย
บทช่วยสอนนี้ไม่ใช่การสาธิตทุกสิ่งที่ Icon Map สามารถทำได้ สิ่งนี้เน้นเฉพาะบริบทของการใช้สตริง Well Known Text ( WKT )
สารบัญ
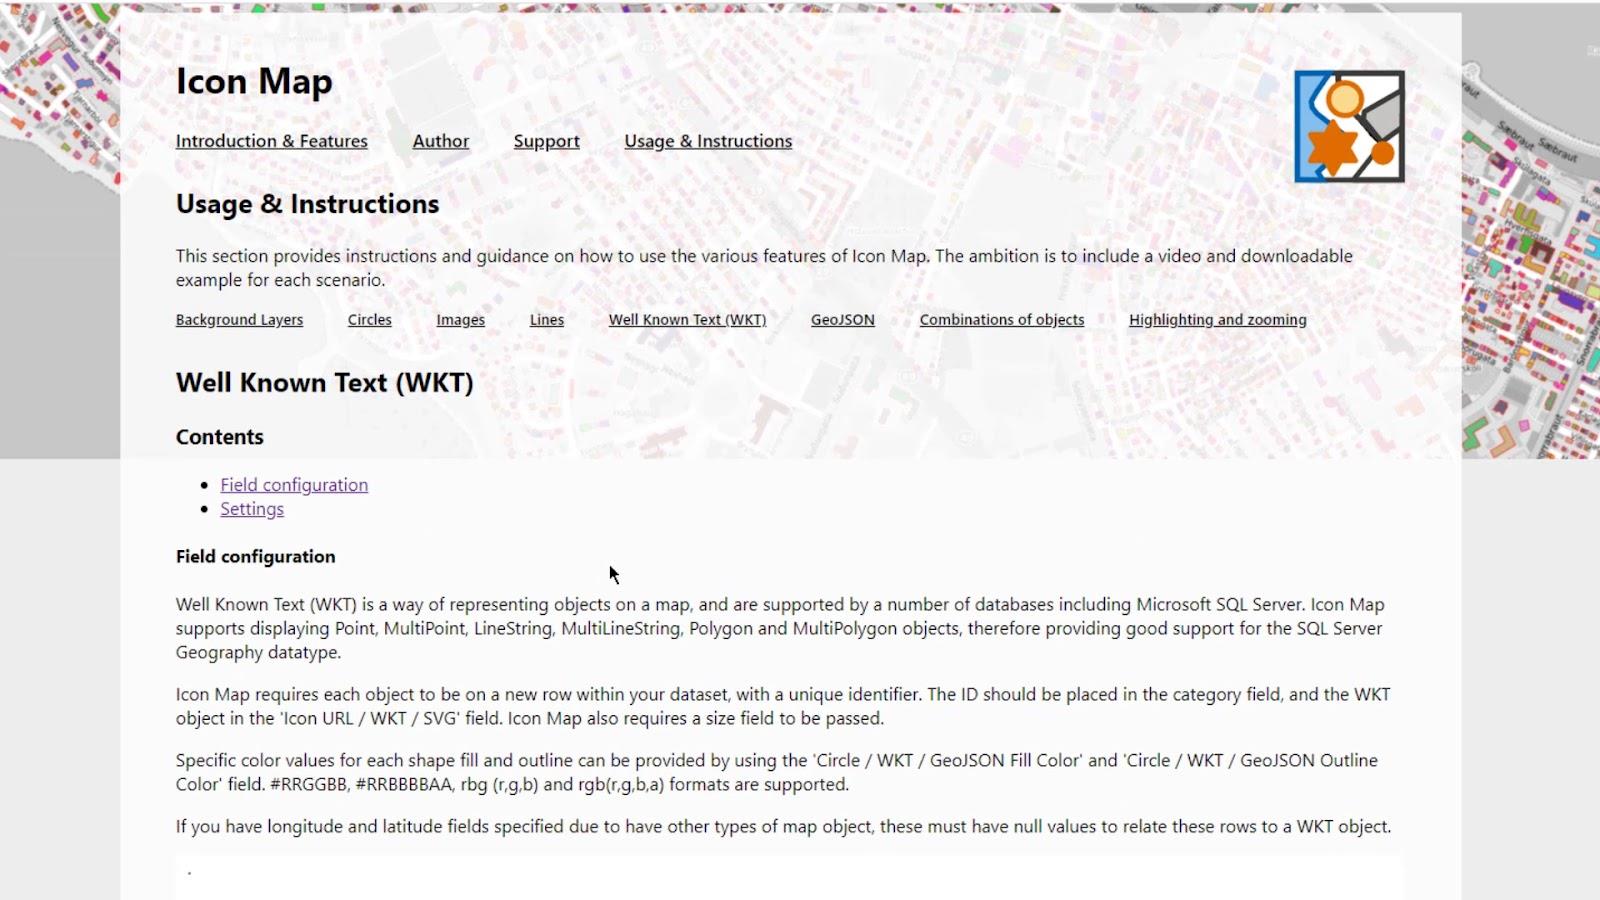
ข้อความที่เป็นที่รู้จัก (WKT) ในแผนที่ไอคอน LuckyTemplates
สตริง ข้อความที่รู้จักกันดีคือการรวมกันของลองจิจูดและละติจูดโดย คั่นด้วย จุด การรวมสิ่งเหล่านี้ไว้ในระเบียนเดียวจะสร้างเส้น รูปร่าง หรือรูปหลายเหลี่ยม
คุณสามารถแปลงข้อมูลละติจูดและลองจิจูดของคุณใน Power Query ได้อย่างง่ายดาย หากคุณไม่มีสตริงข้อความที่รู้จักกันดี
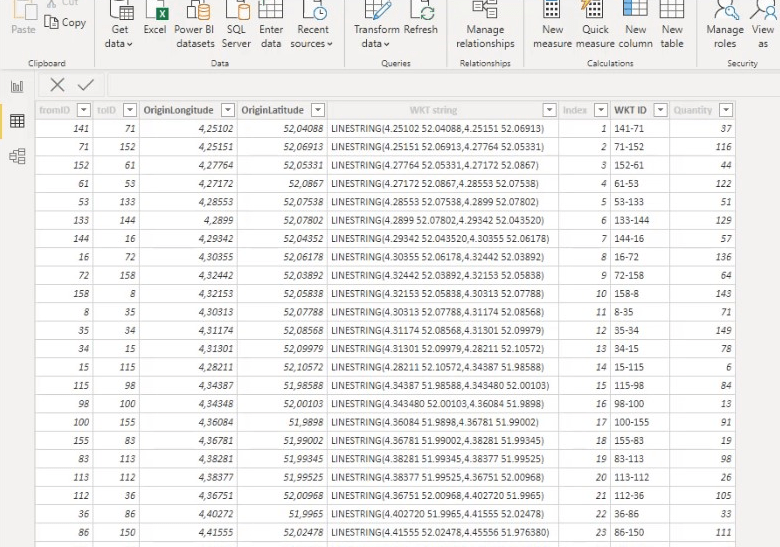
คุณสามารถนำเข้าภาพแผนที่ไอคอน LuckyTemplates จากเว็บไซต์ นี้ (ในขณะที่เขียนบทความนี้ ยังอยู่ในรุ่นเบต้า)
มีตัวอย่างการทำงานมากมายในหน้าเว็บนี้ อย่างไรก็ตาม ภาพและแหล่งที่มาของแอปไม่รองรับการเปลี่ยนแปลงล่าสุดทั้งหมด จากข้อมูลของ James Dales (ผู้พัฒนา) การอนุมัติจาก Microsoft สำหรับรุ่นเบต้านั้นอยู่ระหว่างรอการเขียนนี้
สถานการณ์ตัวอย่างสำหรับการใช้สตริง WKT ในแผนผังไอคอน LuckyTemplates
สำหรับตัวอย่างแรก ฉันจะแสดงวิธีการแสดงเลเยอร์หลายชั้นด้วย สตริง WKTสำหรับท่อแก๊ส ฉันดาวน์โหลดข้อมูลบางอย่างจากเว็บไซต์ของผู้ให้บริการก๊าซในเนเธอร์แลนด์ ฉันได้นำสถานีและท่อส่งเพื่อสร้างตัวอย่างนี้
1. การรวมแบบสอบถาม
ส่วนแรกของตัวอย่างนี้มีไว้สำหรับการรวมข้อความค้นหา
ข้อความ ค้นหา" สถานีบริการน้ำมันสำหรับการรวม " มีคอลัมน์ID ลองจิจูดและละติจูด
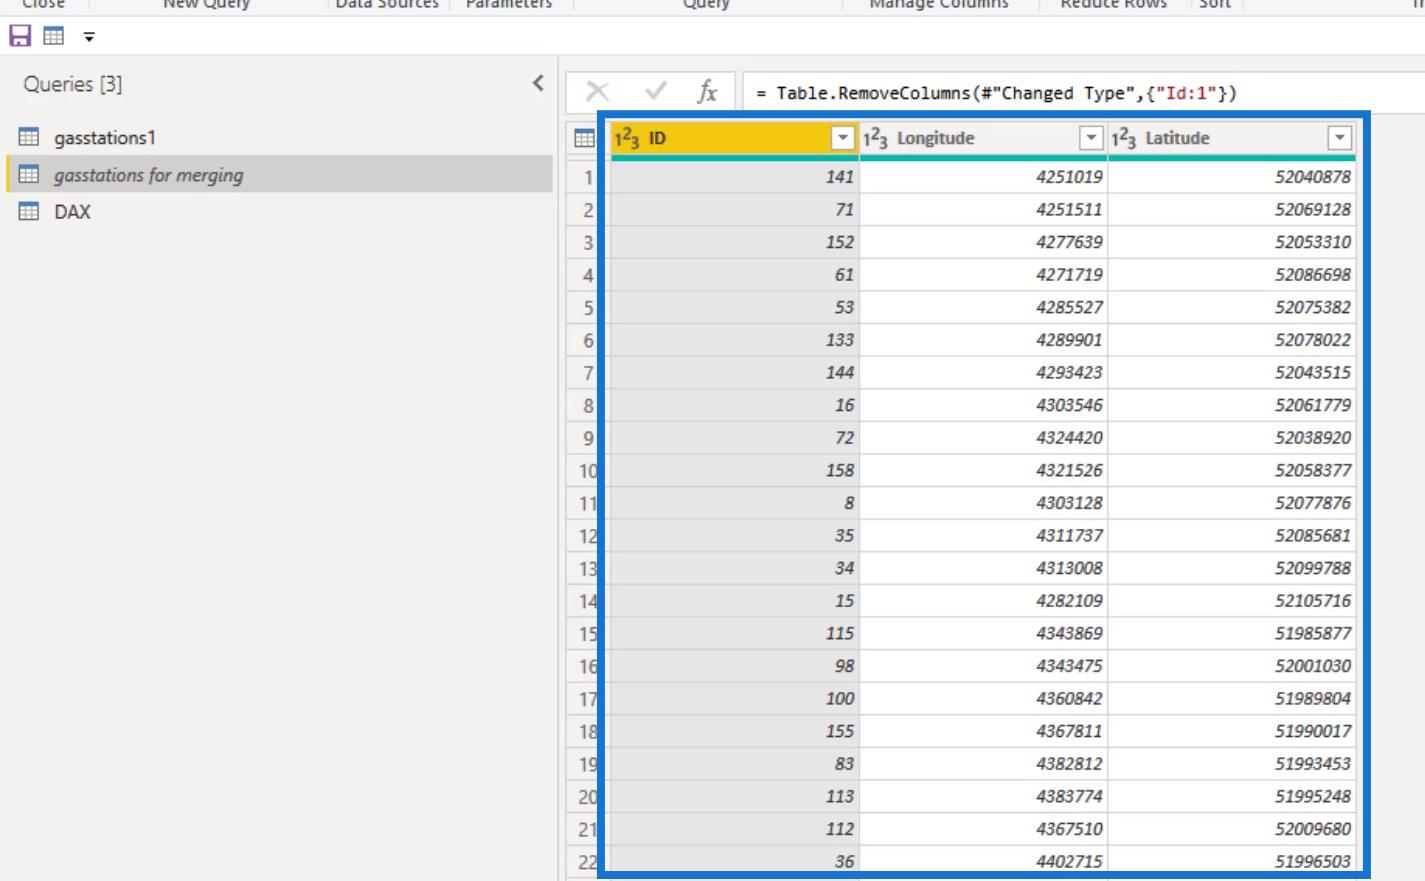
อันดับแรก ฉันสร้างลองจิจูดและละติจูดในคอลัมน์หาร 2 โดยการนำตัวเลขจากคอลัมน์ลองจิจูดและละติจูด มาทำใหม่ อย่างที่คุณเห็นลองจิจูดคล้ายกับ คอลัมน์ แผนกและละติจูดคล้ายกับคอลัมน์แผนก 1
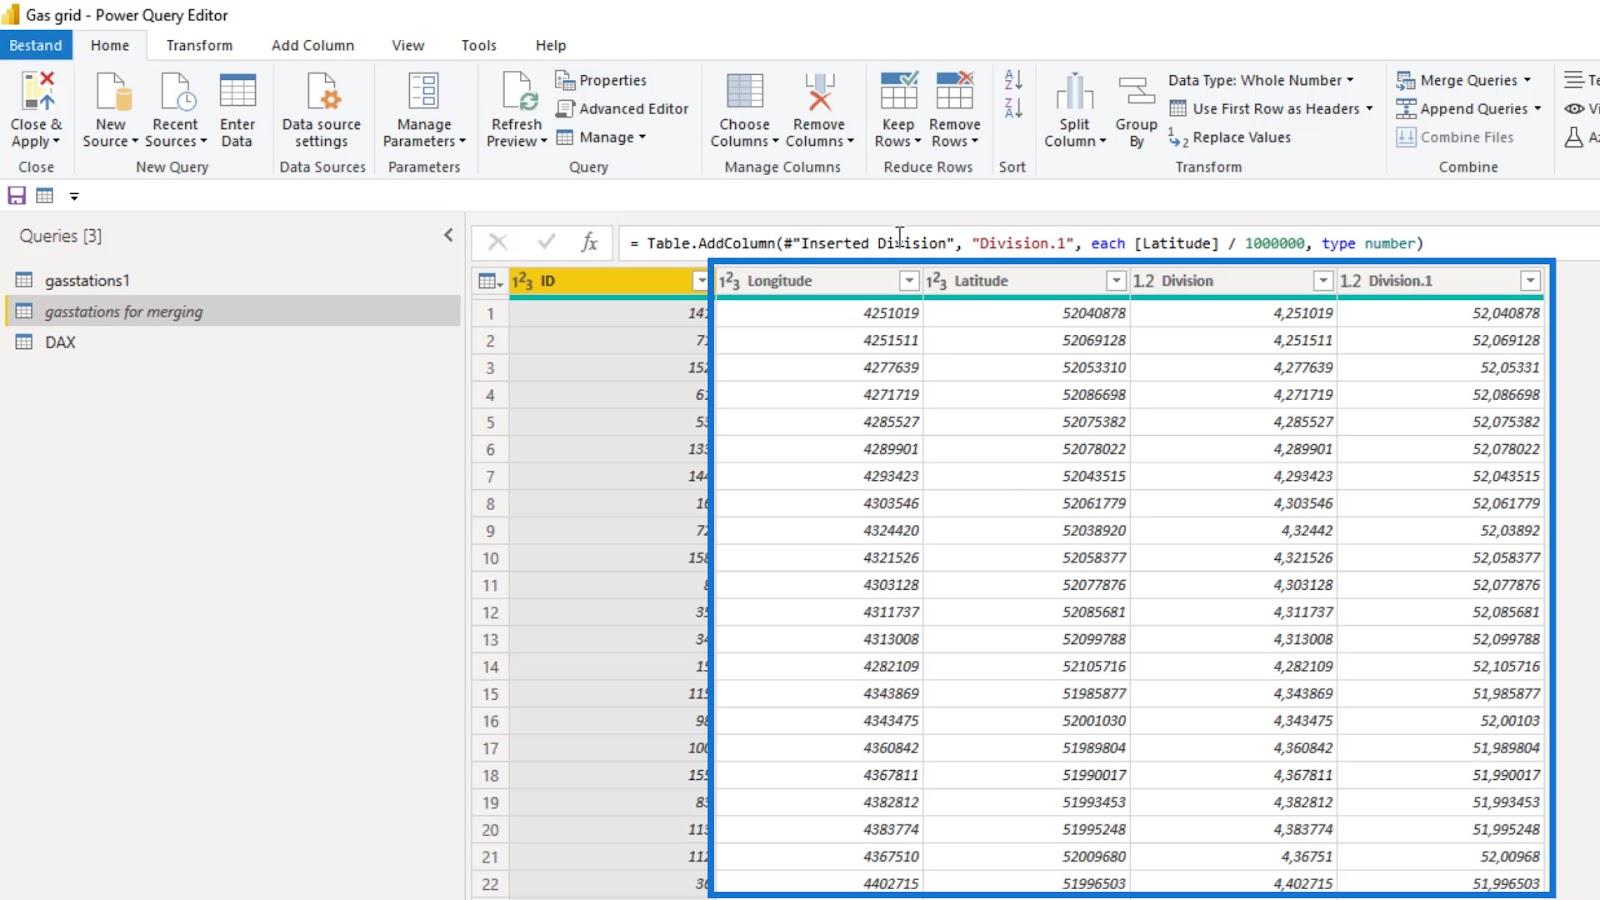
จากนั้นฉันเพิ่มคอลัมน์ดัชนี
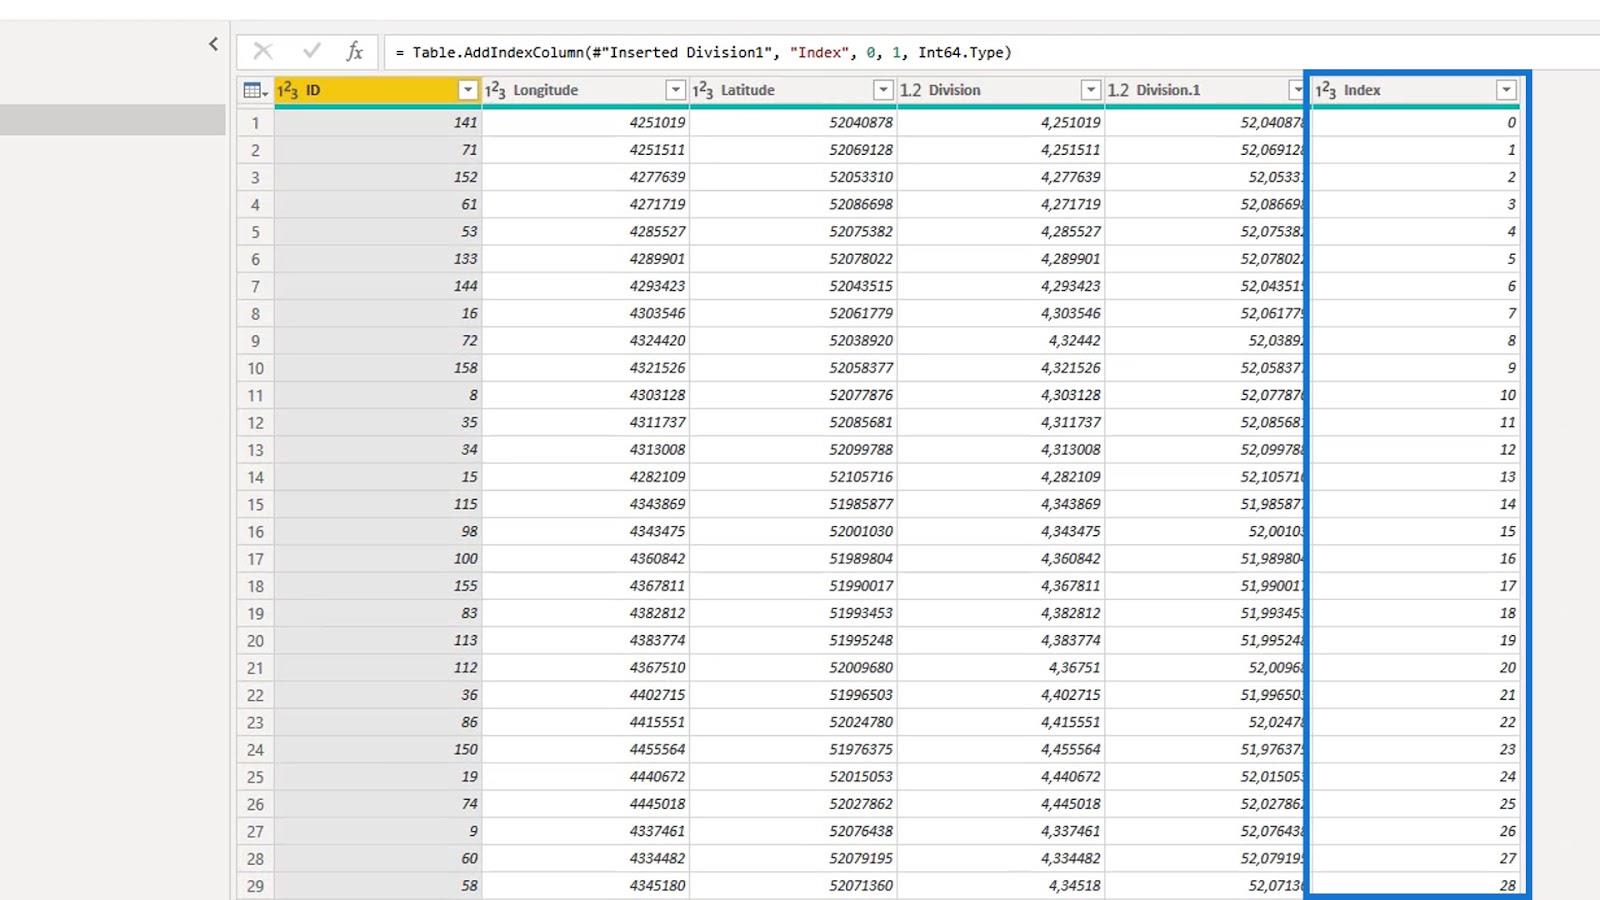
ฉันลบคอลัมน์ลองจิจูดและละติจูด
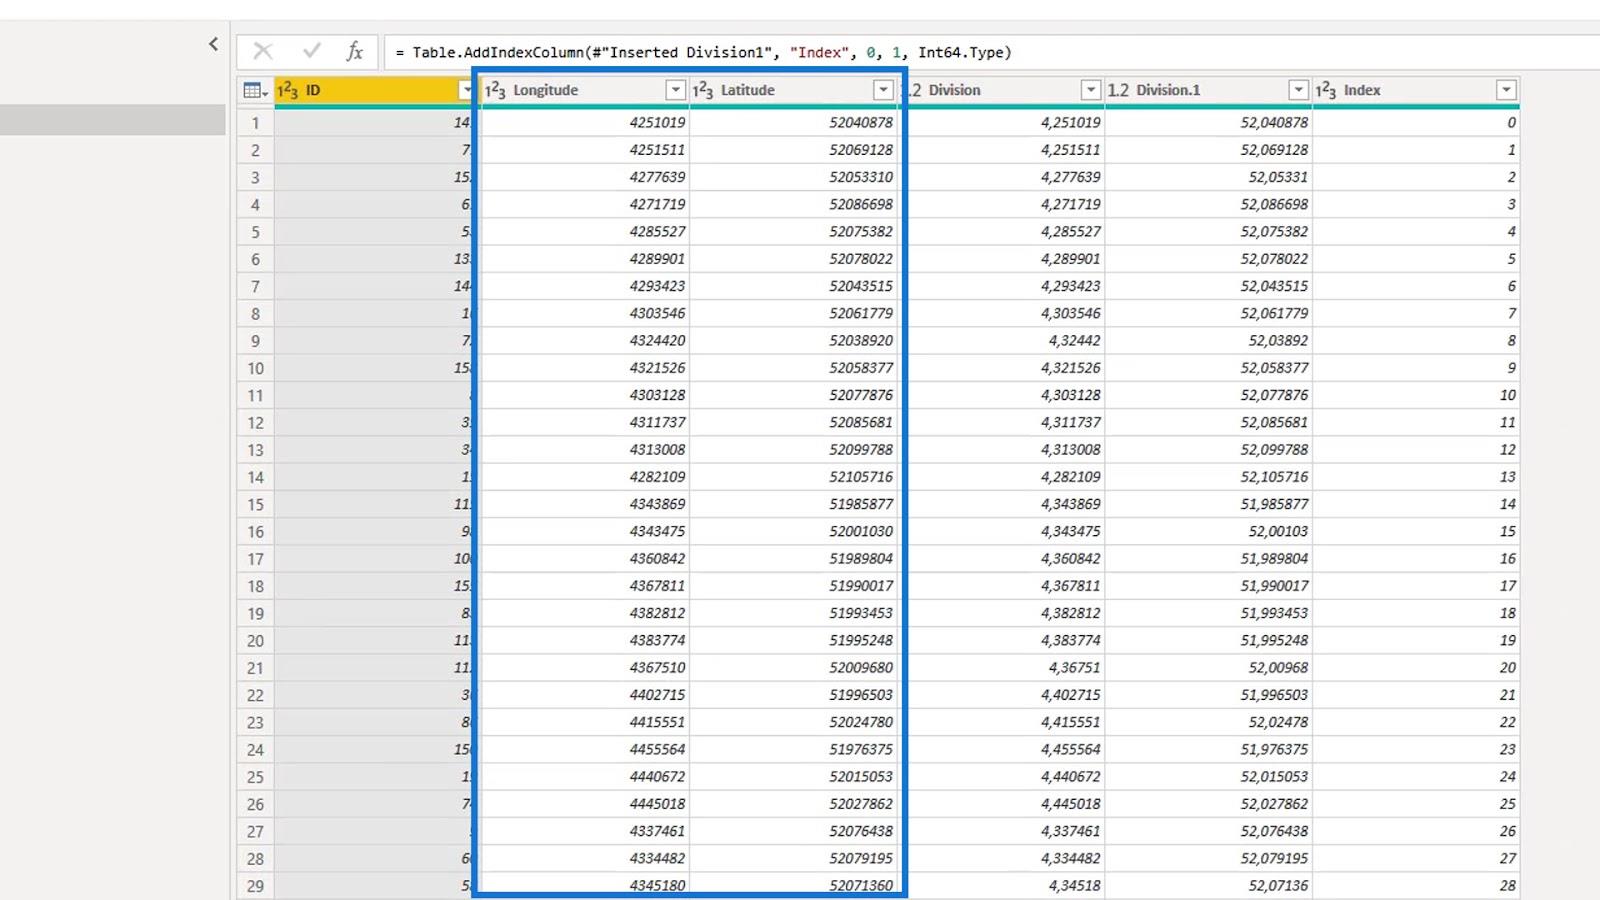
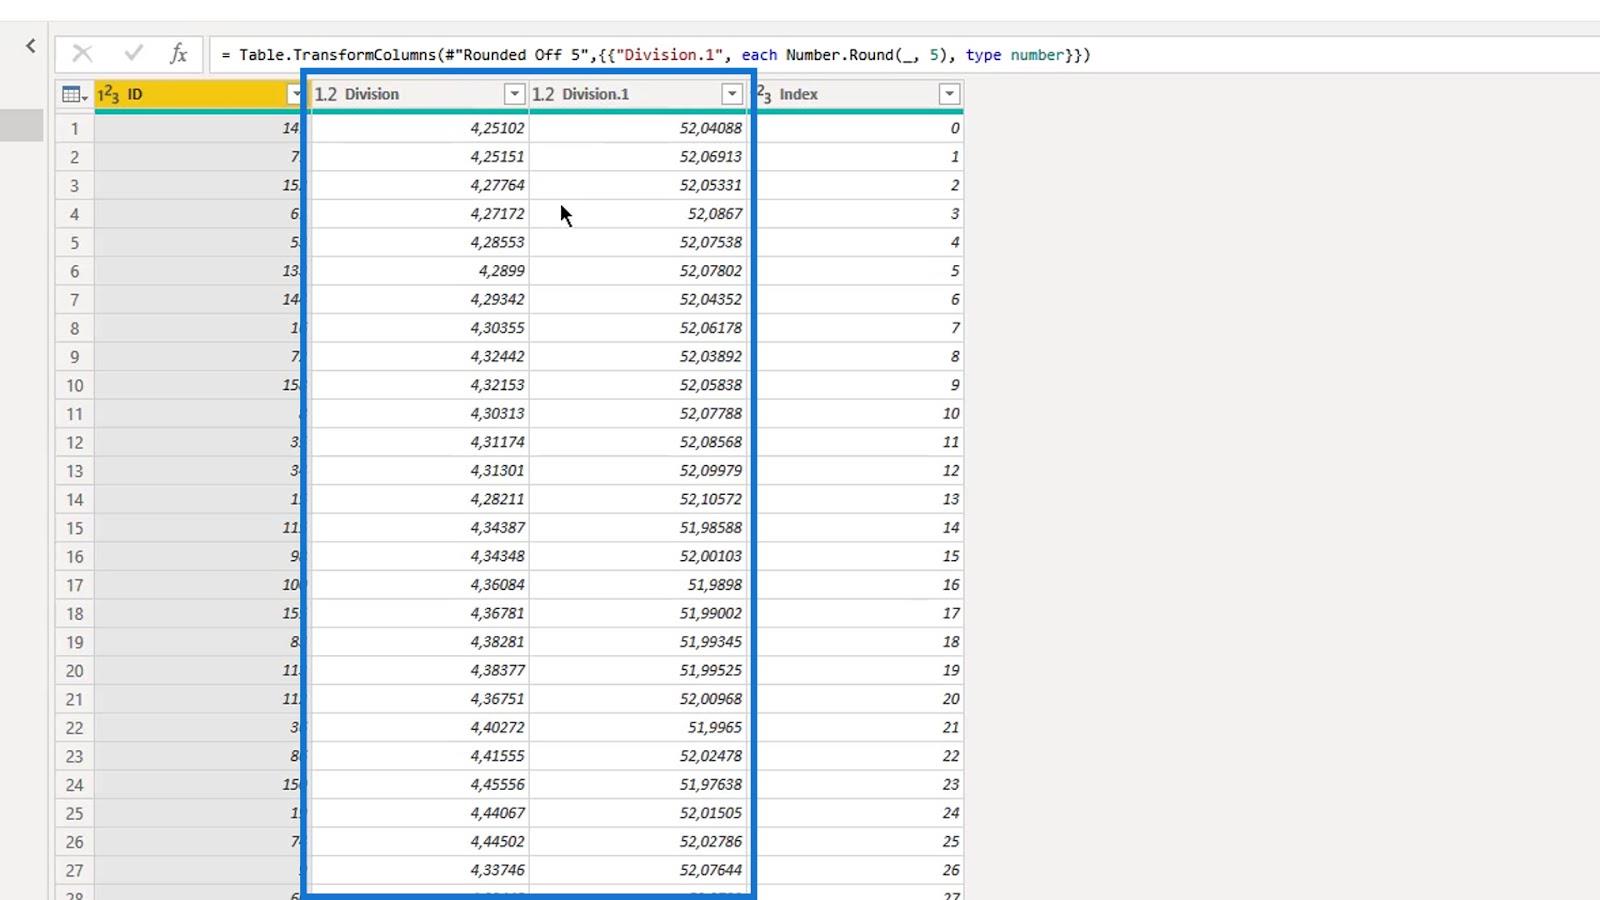
หลังจากนั้น ฉันปัดเศษละติจูดและลองจิจูดที่ปรับปรุงใหม่ให้เป็นตัวเลขห้าหลัก
การปัดเศษให้เป็นตัวเลขห้าหลักจะทำให้มีความแม่นยำประมาณหนึ่งเมตร ซึ่งดีเพียงพอในสถานการณ์นี้ โดยปกติ ฉันจะปัดเศษลงเป็นสี่เพียงเพื่อประหยัดหน่วยความจำมากขึ้น
ฉันทำซ้ำข้อความค้นหา " gasstations สำหรับการผสาน " ซึ่งมี คอลัมน์ดัชนี เป็นศูนย์และตั้งชื่อเป็นข้อความค้นหา " gasstations1 "
ในแบบสอบถามนี้ ฉันสร้าง คอลัมน์ ดัชนี อีก คอลัมน์ที่ขึ้นต้นด้วย1
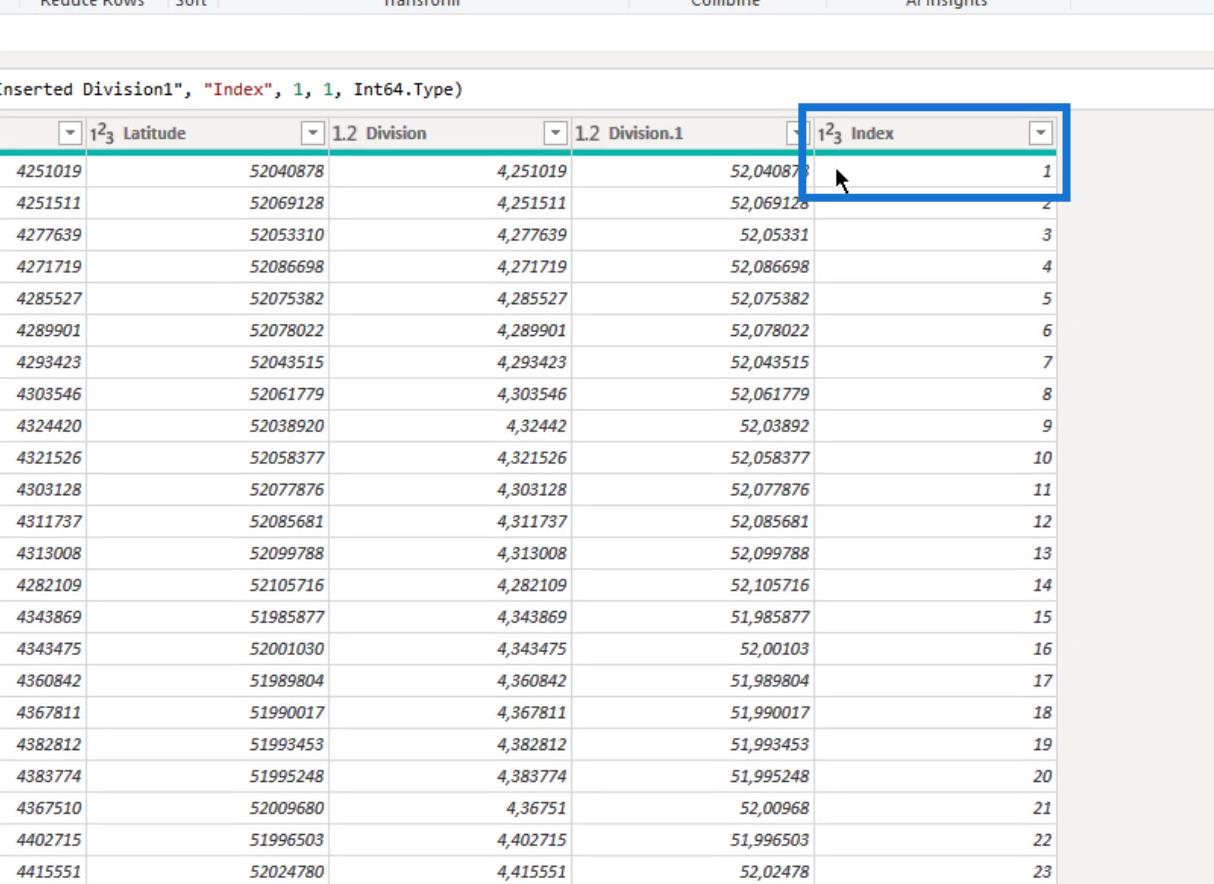
เป้าหมายของฉันในการค้นหานี้คือการสร้างคู่ของลองจิจูดและละติจูดสำหรับปั๊มน้ำมันแต่ละแห่ง จากนั้นรวมสองคู่ตามลำดับเป็นสตริงข้อความเดียวในระเบียนเดียว นี่จะแสดงส่วนของท่อส่งระหว่างสถานี
ฉันใช้ คอลัมน์ ดัชนีเพื่อรวมสองข้อความค้นหา ด้วยเหตุนี้ ระเบียนที่มี1 เป็นดัชนีในแบบสอบถาม " gasstations1 " และระเบียนที่มี1 เป็นดัชนีในแบบสอบถามเดิม ( ปั๊มน้ำมันสำหรับการรวม ) จะถูกรวมเข้าด้วยกัน
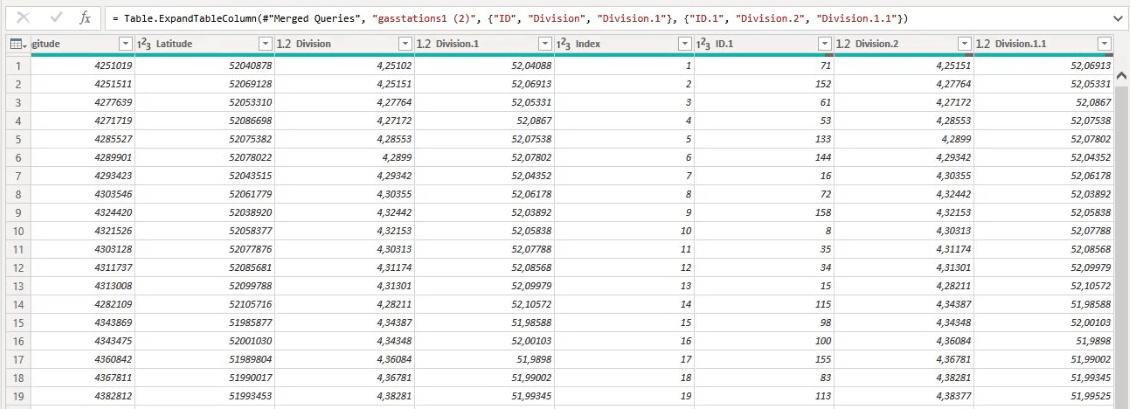
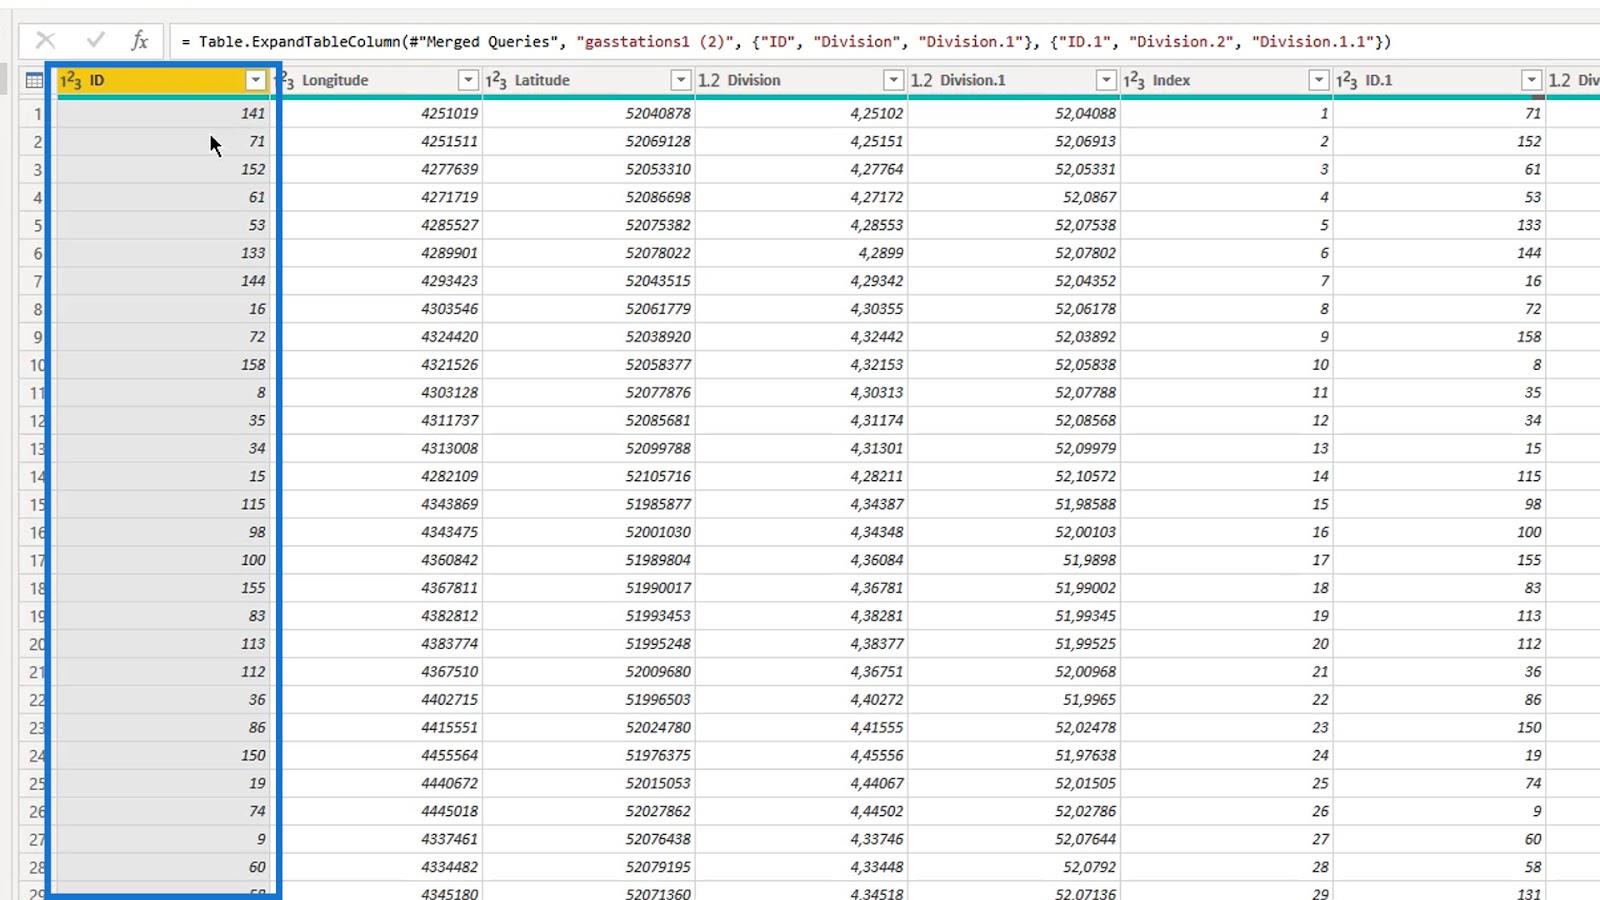
ฉันทำตามลำดับใน คอลัมน์ IDและเชื่อมต่อสถานีเป็นสองคู่
ดังนั้น141และ71จึงเป็นสถานีที่อยู่ติดกันตามที่แสดงในระเบียนเดียว เป็นคู่ พวกมันเป็นตัวแทนของส่วนนั้นของท่อก๊าซ ซึ่งรวมถึง71และ152และระเบียนที่สำเร็จในคอลัมน์ ID
2. การขยายตาราง
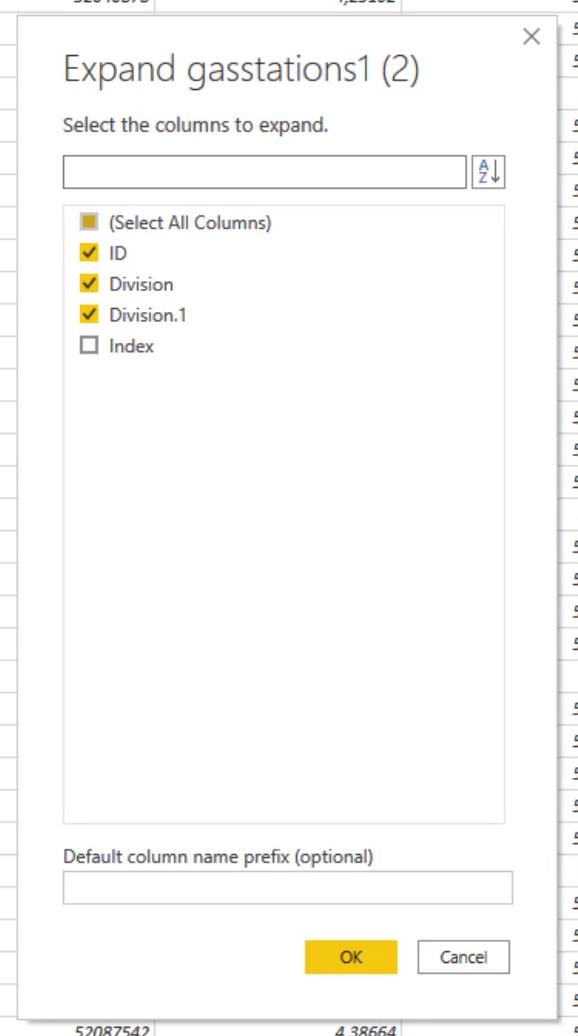
หลังจากรวมข้อความค้นหาตาม คอลัมน์ ดัชนีแล้ว ฉันต้องขยายตารางและเก็บคอลัมน์ID , LatitudeและLongitude ไว้ รหัสนี้ใช้เป็นส่วนสองสถานีของรหัสข้อความที่รู้จักกันดี ฉันไม่ได้เปลี่ยนชื่อเพราะฉันไม่ต้องการคอลัมน์เหล่านี้ในภายหลัง
3. การสร้างและการรวมเส้นทาง fromstring และ tostring
ก่อนอื่น ฉันสร้างคอลัมน์fromstringและtostring
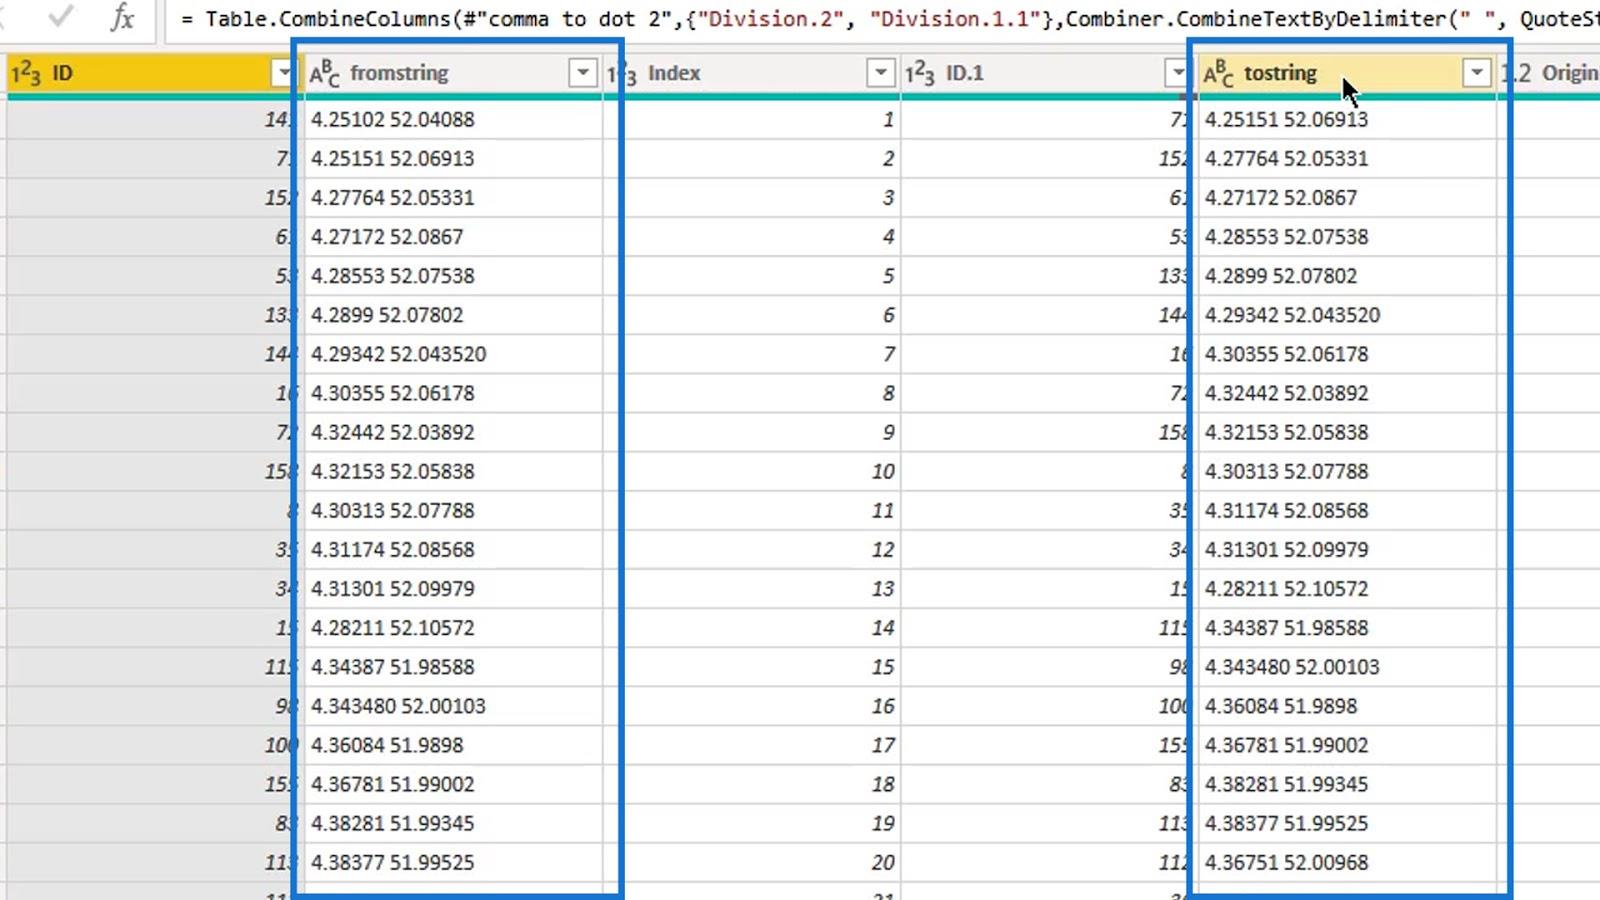
จากนั้นฉันรวมเข้าด้วยกันเป็นคอลัมน์เดียวและตั้งชื่อว่า " ผสาน "
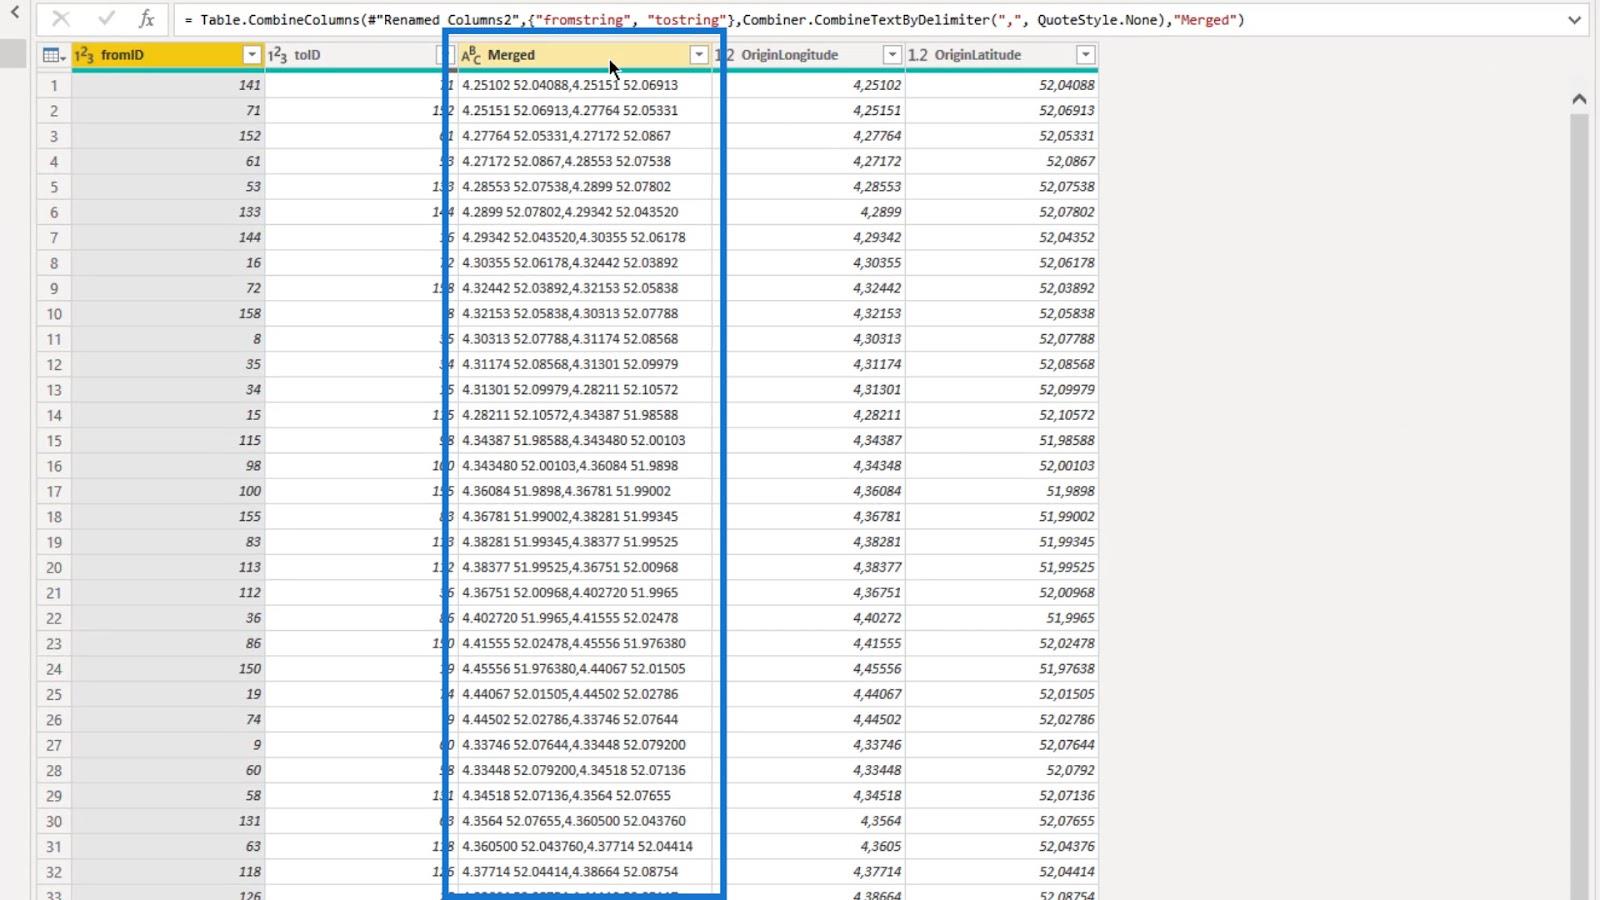
4. การสร้างข้อความที่รู้จักกันดี
หลังจากสร้าง คอลัมน์ fromstringและtostring แล้วฉันได้สร้างคอลัมน์สตริง WKT
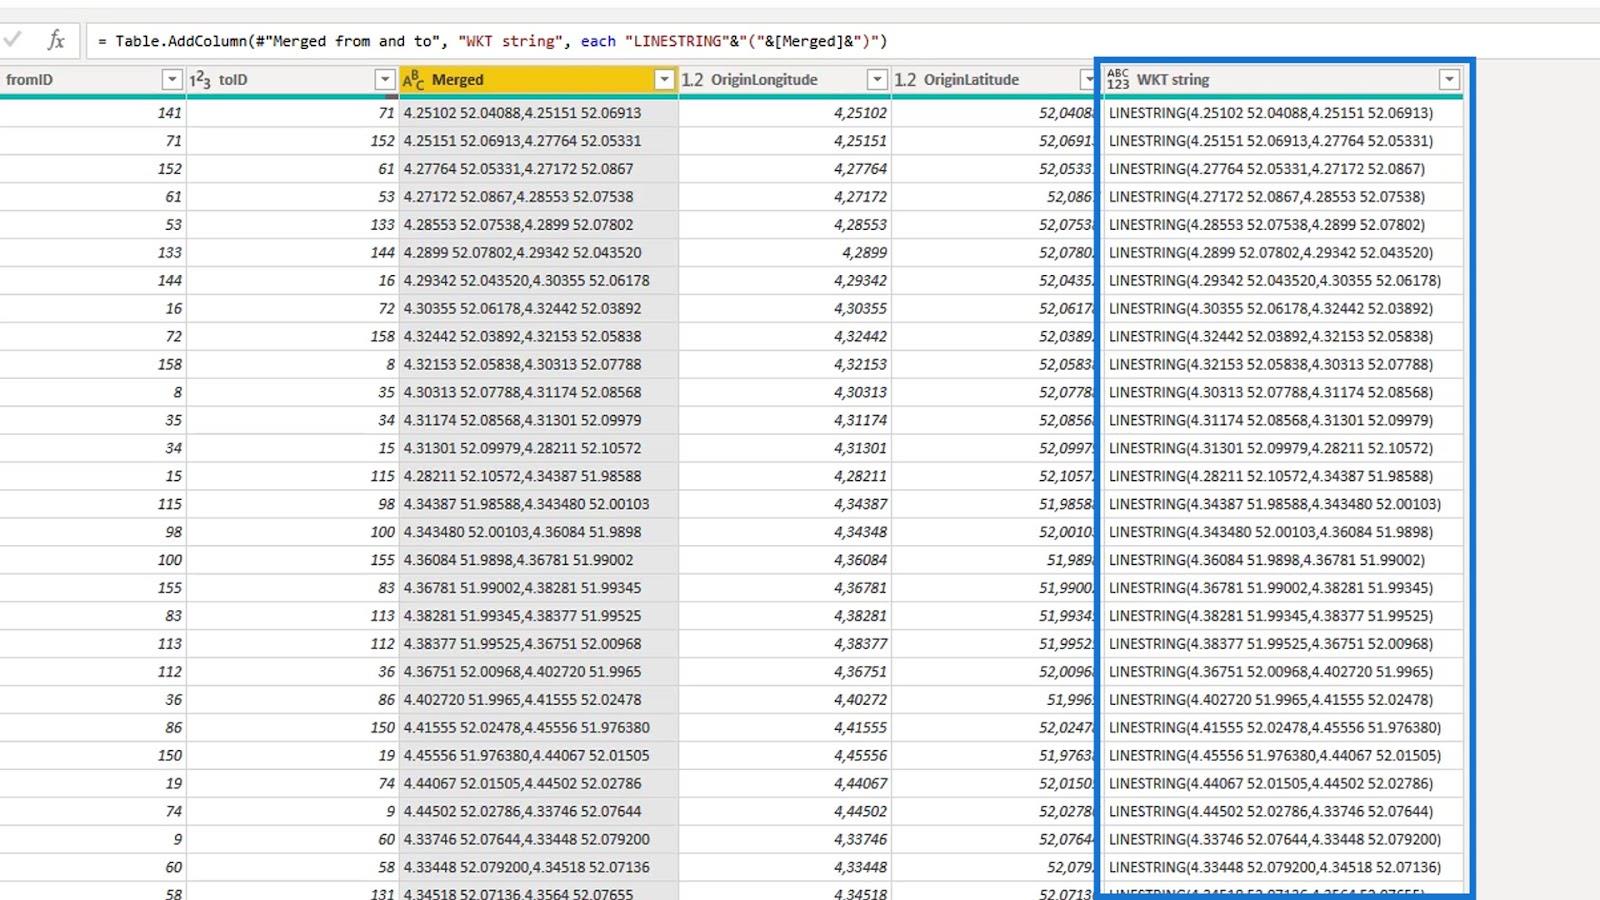
ข้อความที่รู้จักกันดีถูกสร้างขึ้นโดยการเพิ่มคำหลักLINESTRINGลงในคอลัมน์ที่ผสาน
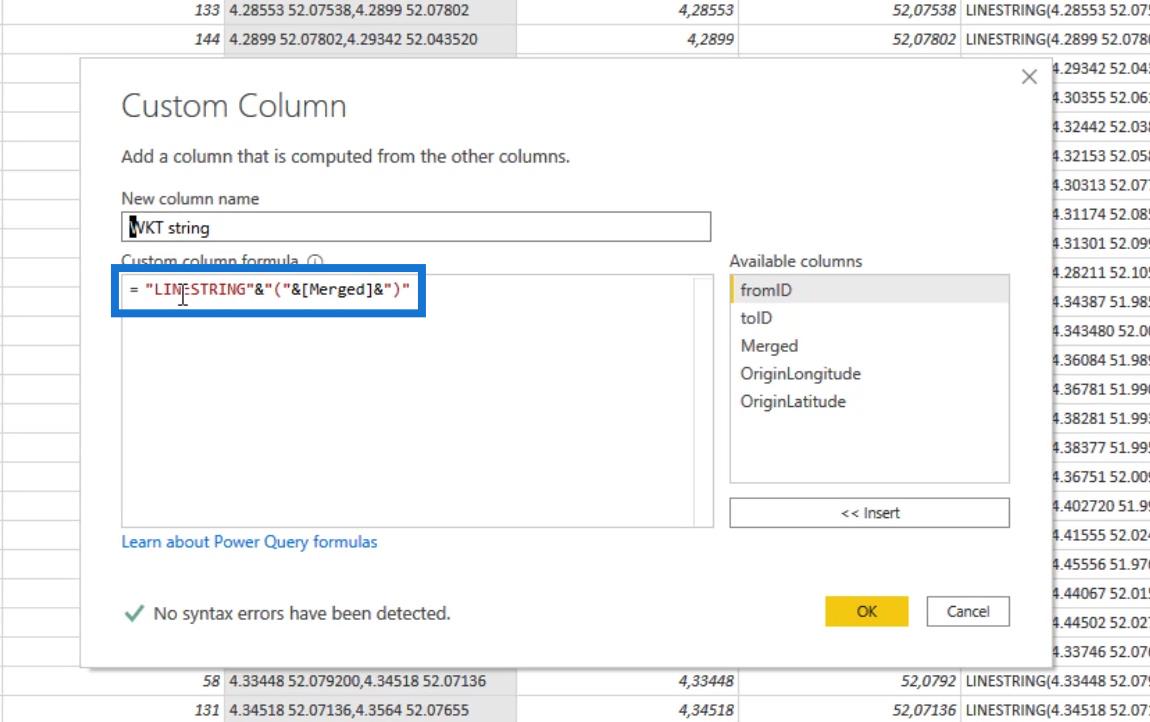
ดังนั้น ตอนนี้จึงมีคุณสมบัติเป็น สตริง ข้อความที่รู้จักกันดีซึ่งจะได้รับการยอมรับโดยภาพแผนที่ไอคอน LuckyTemplates
สิ่งต่อไปที่ฉันทำคือลบคอลัมน์ที่ผสาน
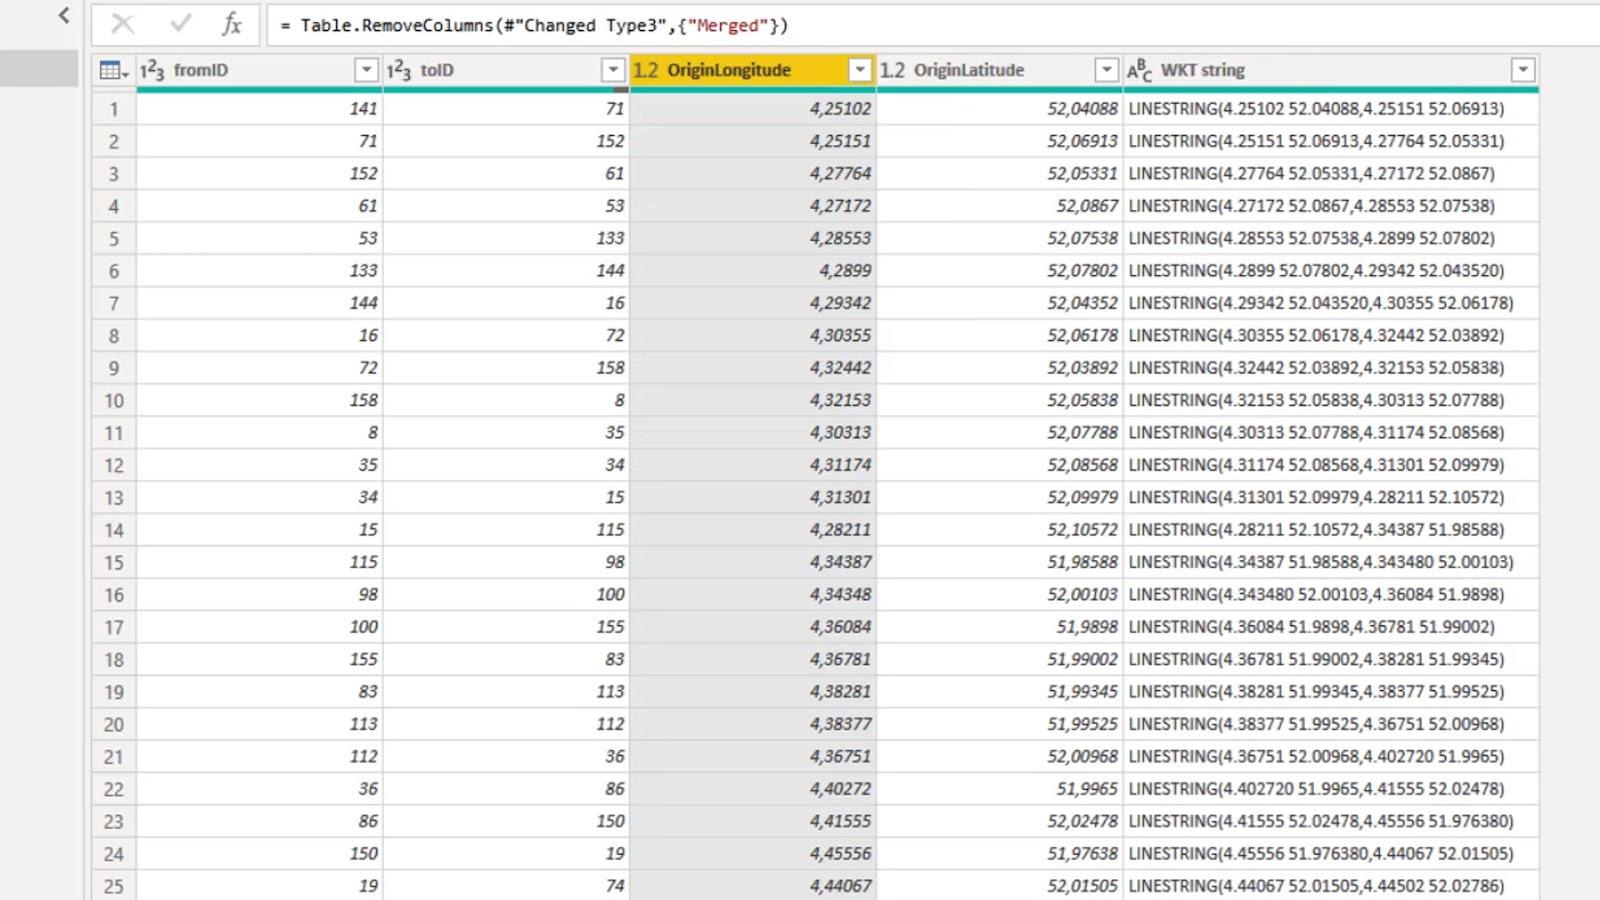
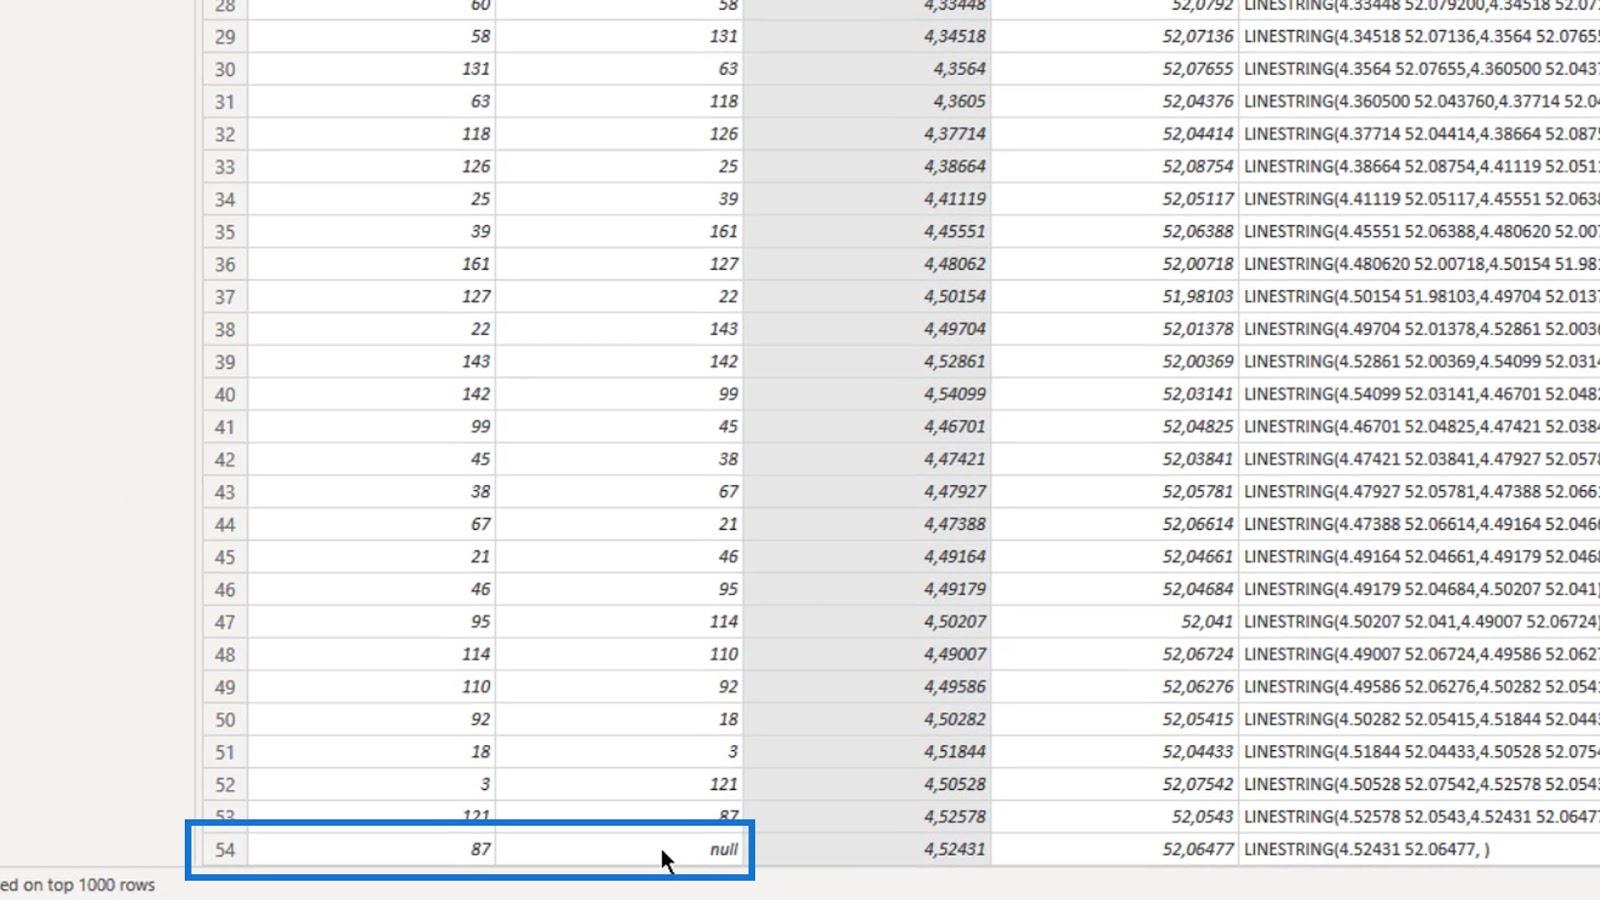
อย่างที่คุณเห็น ไม่มีค่าในแถวสุดท้าย เนื่องจากไม่มีสถานีอยู่ติดกัน ดังนั้นฉันจึงลบแถวสุดท้ายออก
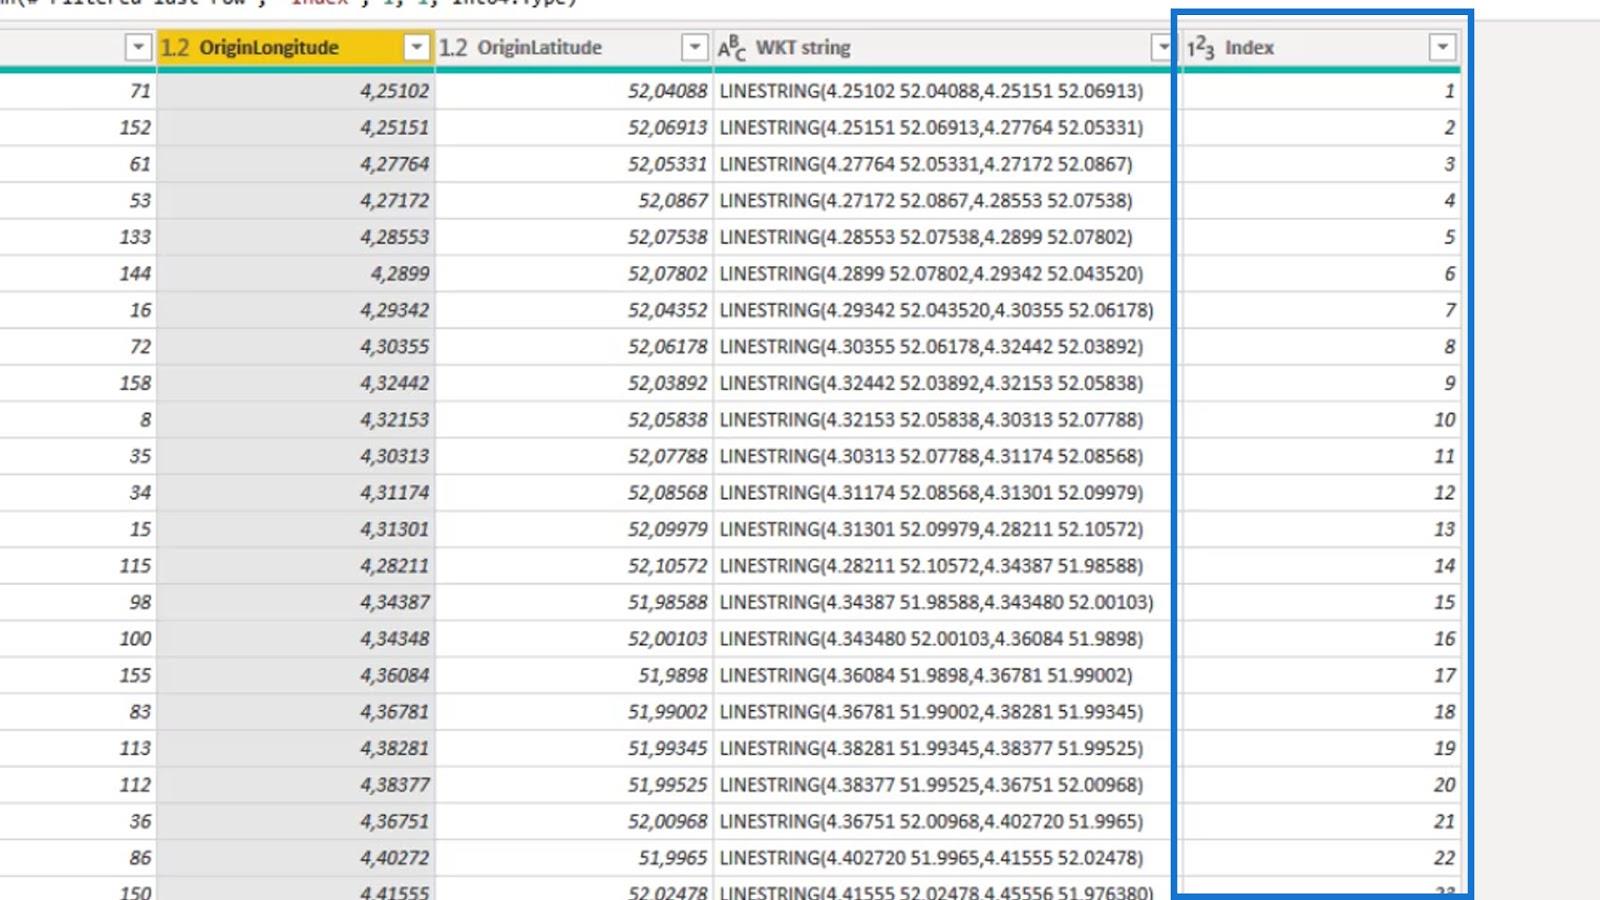
ฉันยังได้เพิ่ม คอลัมน์ ดัชนีสำหรับการเรียงลำดับ รหัส ข้อความที่รู้จักกันดีที่ฉันสร้างขึ้นในวิชวล
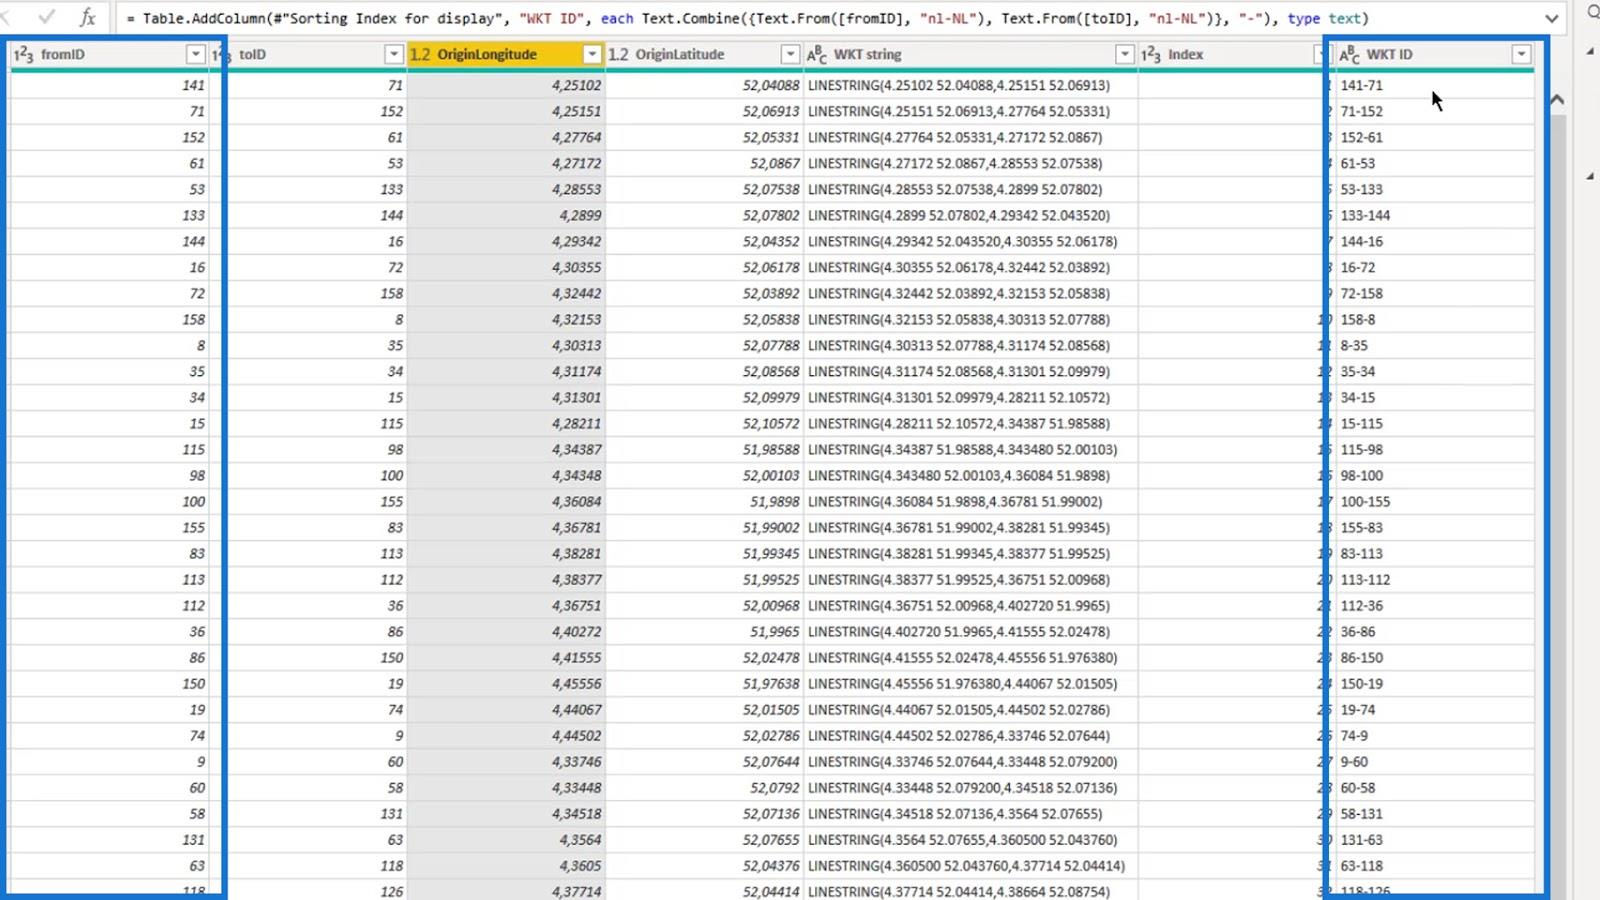
นอกจากนี้ ฉันได้เพิ่มคอลัมน์ Well Known Text ID ( WKT ID ) ซึ่งเป็นการรวมกันของคอลัมน์ fromIDและtoID
5. การเพิ่มมูลค่าให้กับข้อมูลภาพโดยไม่มีค่า
ฉันต้องการเพิ่มมูลค่าให้กับข้อมูลภาพของฉันที่ไม่มีค่าใดๆ
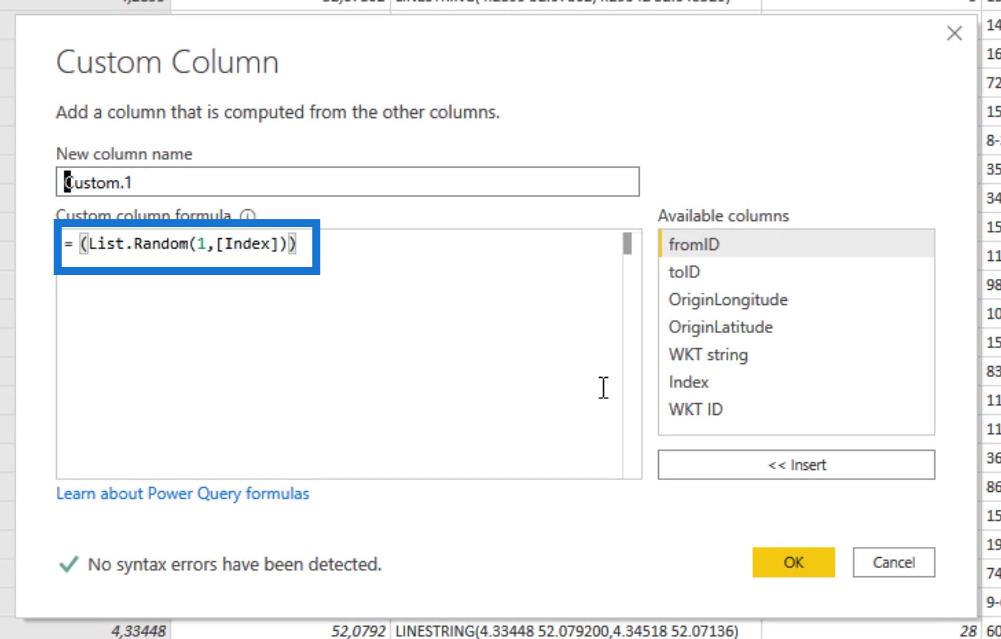
ในการทำเช่นนี้ ฉันสร้างคอลัมน์ค่าสุ่มโดยใช้ ฟังก์ชัน List.Randomและคอลัมน์ดัชนี จากนั้นค่าดังกล่าวอาจแสดงถึงความดัน ปริมาณ หรือเวลาที่ไม่มีการบำรุงรักษา นี่เป็นเพียงการแสดงบางสิ่งในภาพ
6. การกรอกข้อมูลในฟิลด์สำหรับภาพแผนที่ไอคอน LuckyTemplates
เนื่องจากฉันดาวน์โหลด รูปภาพ แผนที่ไอคอนจากเว็บไซต์แล้ว ฉันจึงสามารถคลิกที่นี่ได้ง่ายๆ
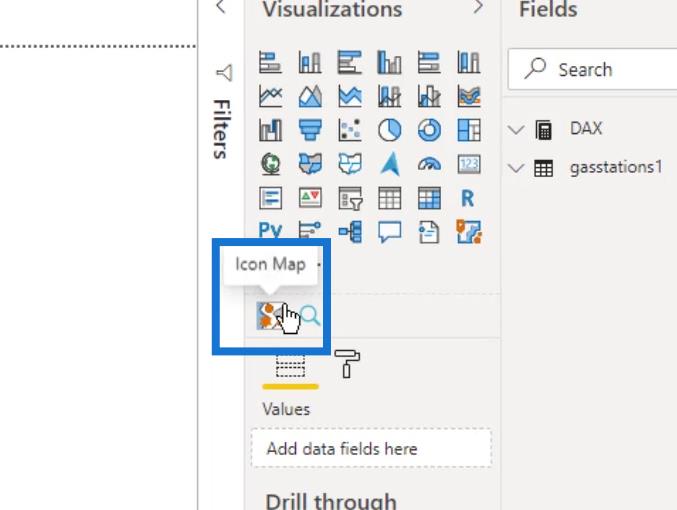
มีความซับซ้อนในการใช้วิชวลเนื่องจากการตั้งค่าที่มีอยู่หลากหลาย ฉันจะแนะนำคุณเกี่ยวกับบางส่วนอย่างรวดเร็ว
ฟิลด์ที่จำเป็นเพื่อให้วิชวลทำงานได้จะถูกทำเครื่องหมายเป็น " (จำเป็น) "
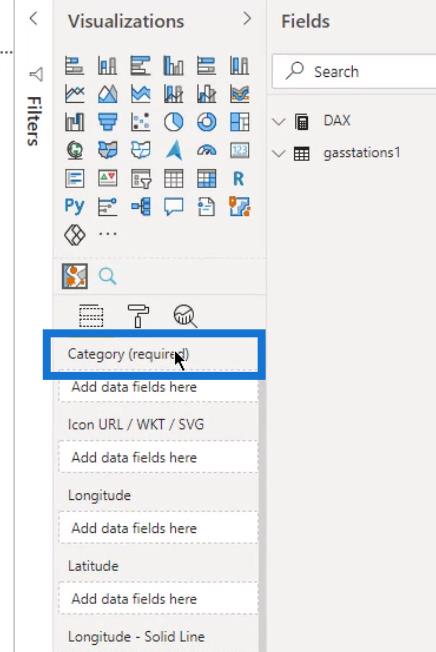
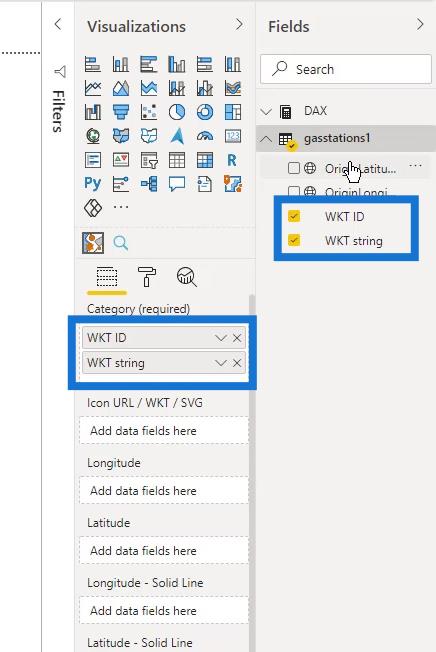
ในการแสดงสถานีหรือท่อน้ำมัน ฉันได้เพิ่มทั้งรหัส WKTและสตริง WKTในฟิลด์หมวดหมู่
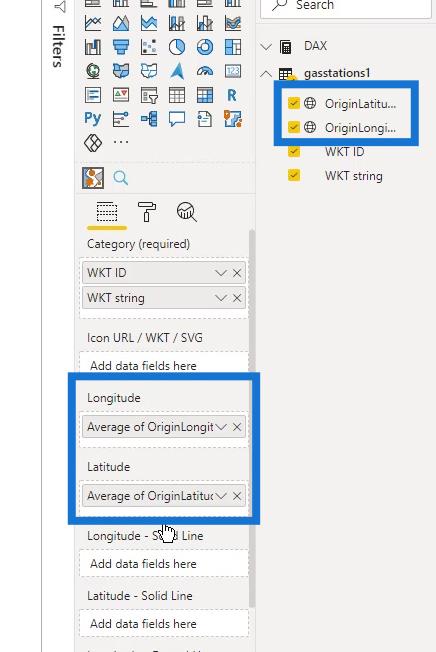
ฉันยังเพิ่มลองจิจูดและละติจูด
จากนั้น ฉันได้เพิ่มหน่วย วัด ปริมาณรวมในช่องขนาด
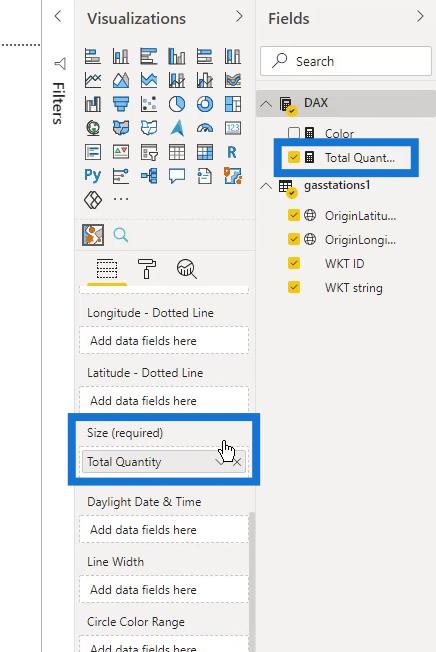
การ วัด ปริมาณรวมเป็นผลรวมของ คอลัมน์ ปริมาณภายในตารางgasstations1
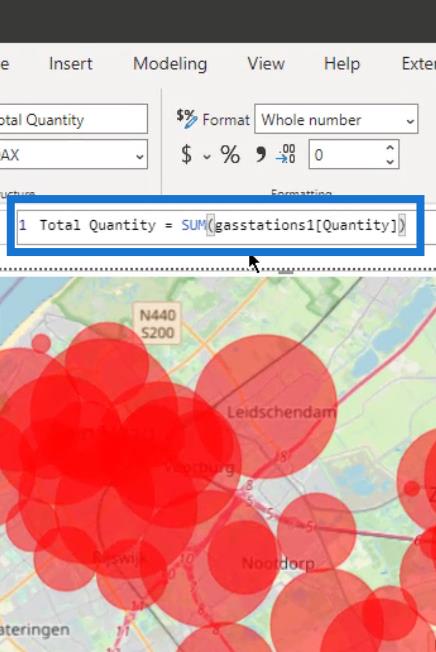
As you can see, I already have a map here. However, it’s not really what I want yet.
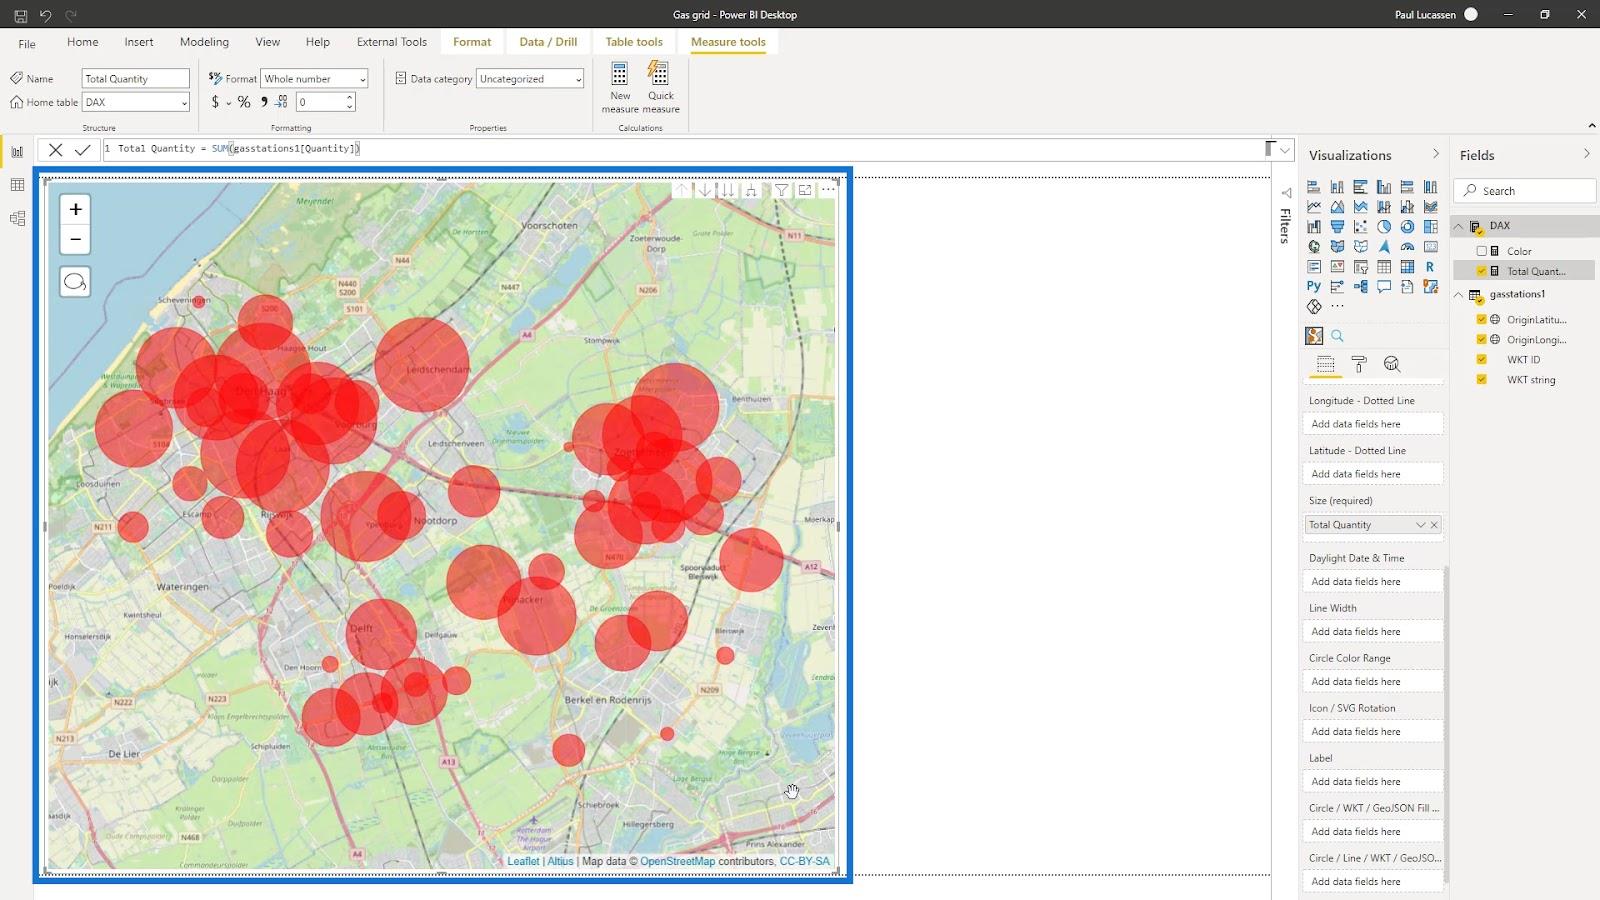
7. Modifying The Icon Map Visual In LuckyTemplates
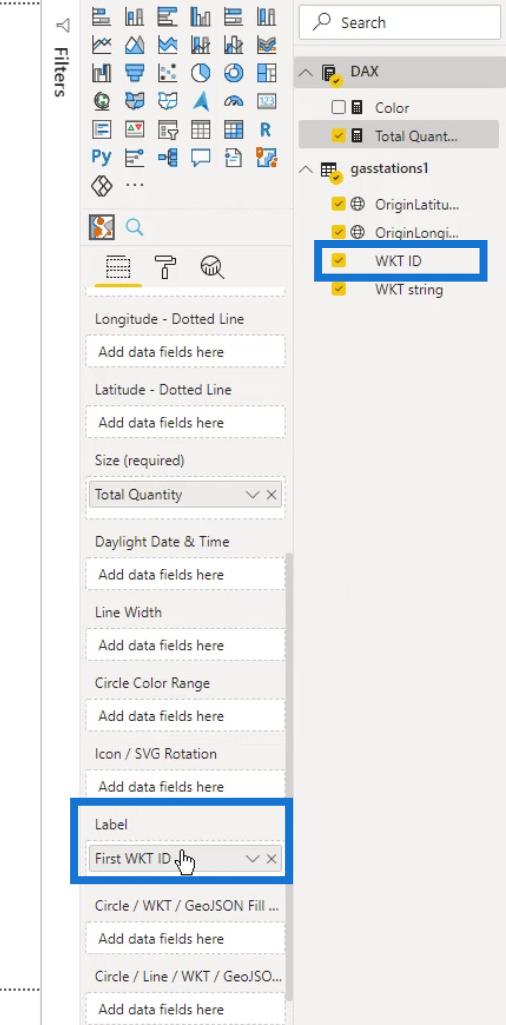
I need to create some labels to make it look better. So, I placed the WKT ID column within the Label field.
I also have a simple color measure and I’ll put it on the field here.
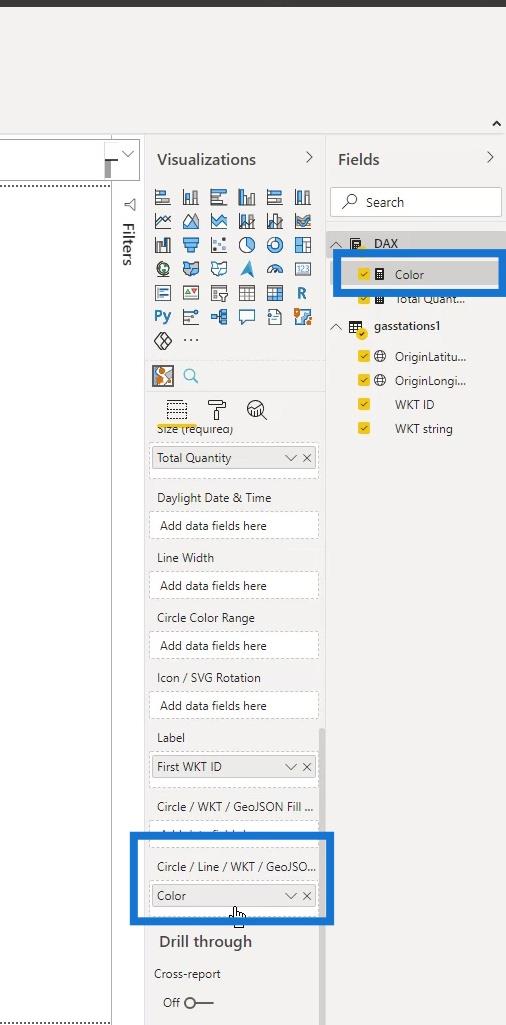
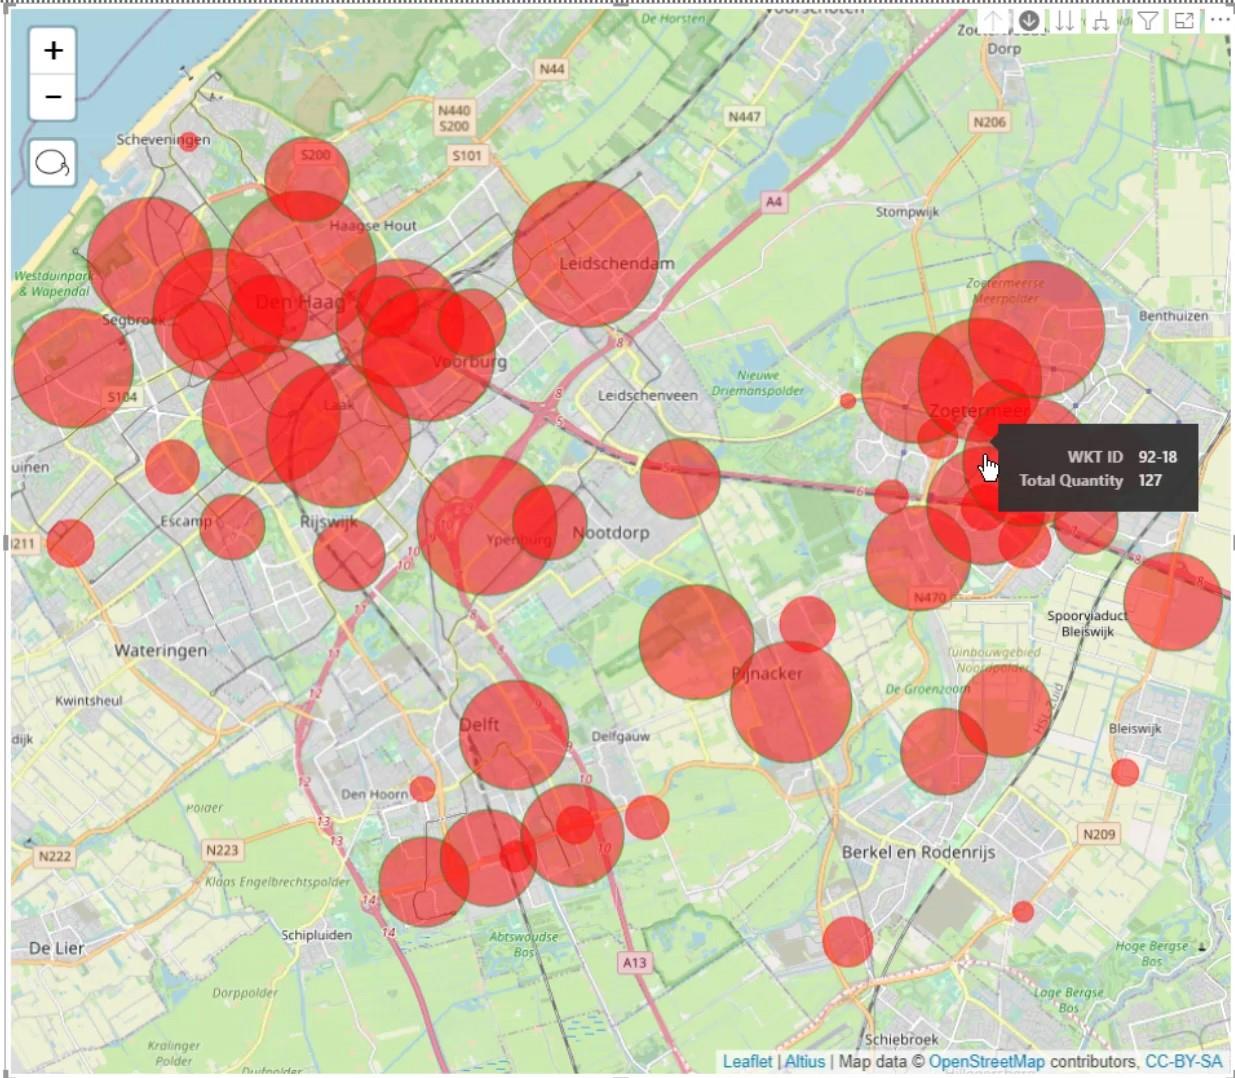
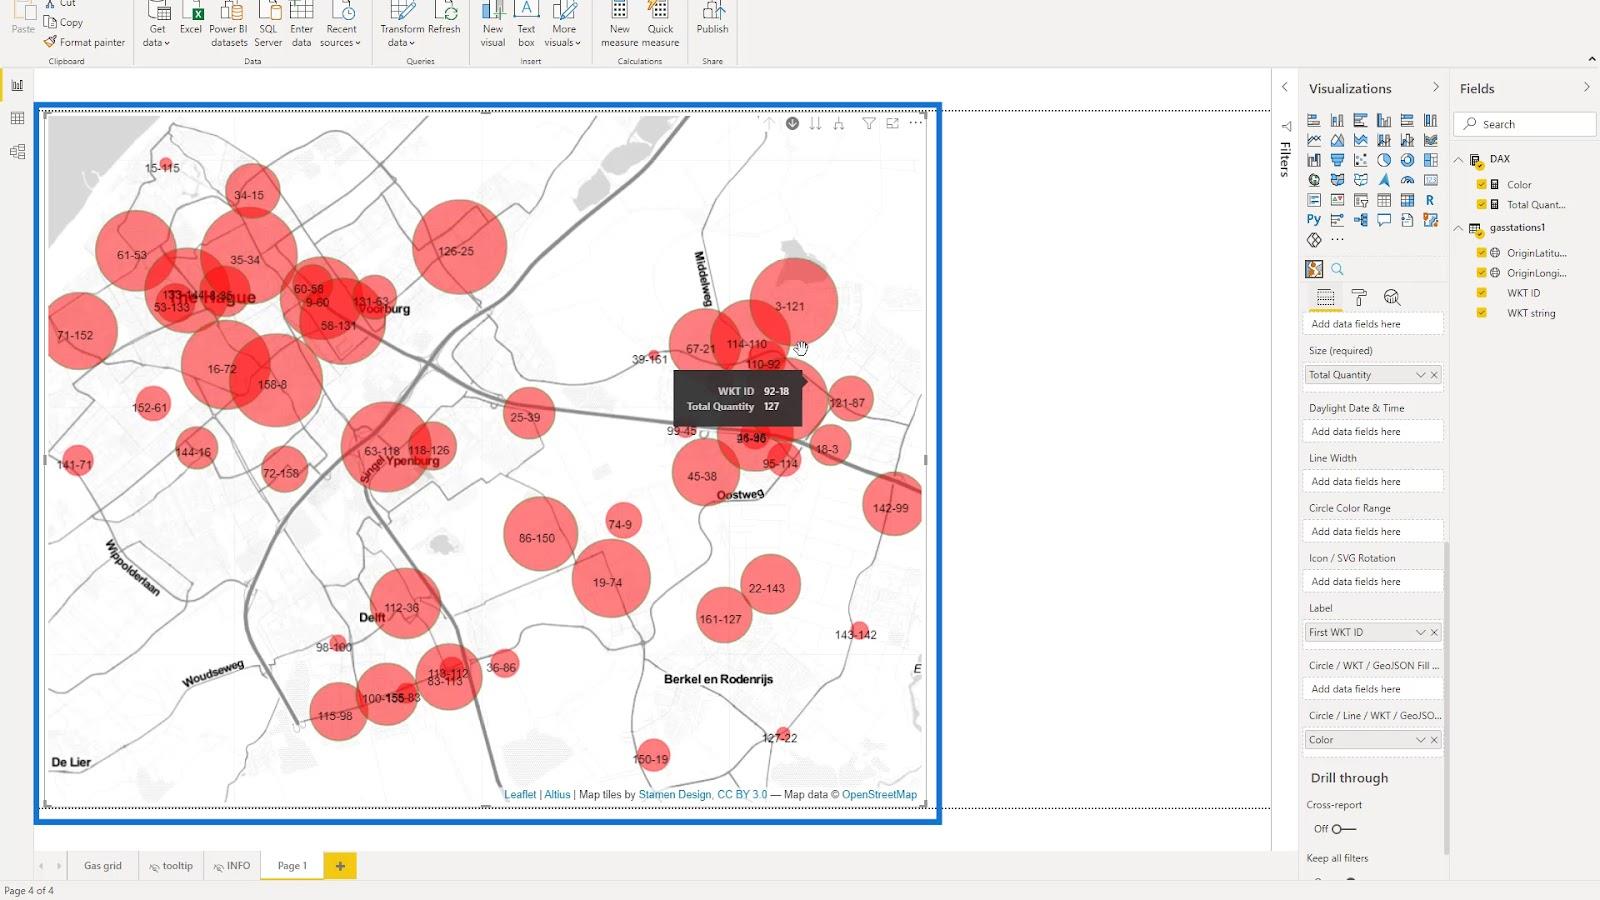
I can now use this map to display gas stations like this.
By clicking here, I can also display the layer of gas lines.
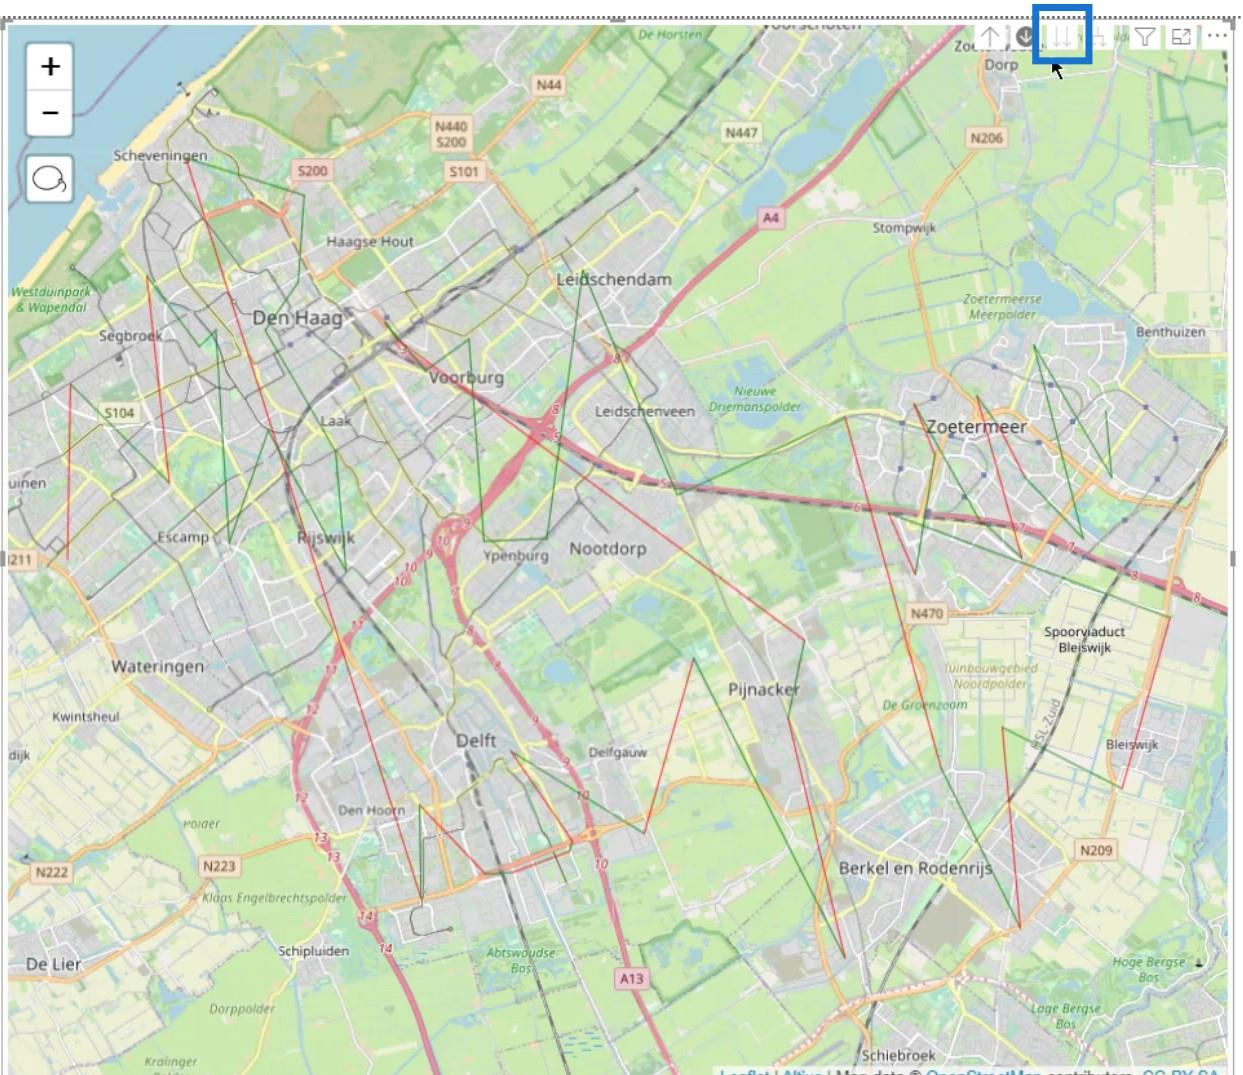
However, there are still some things that I need to do so I can make this look better.
To start, I’ll go to the Formatting pane. Then, under the Background Layers, I’ll select the Stamen – TonerLite. This provides a selection of different types of backgrounds
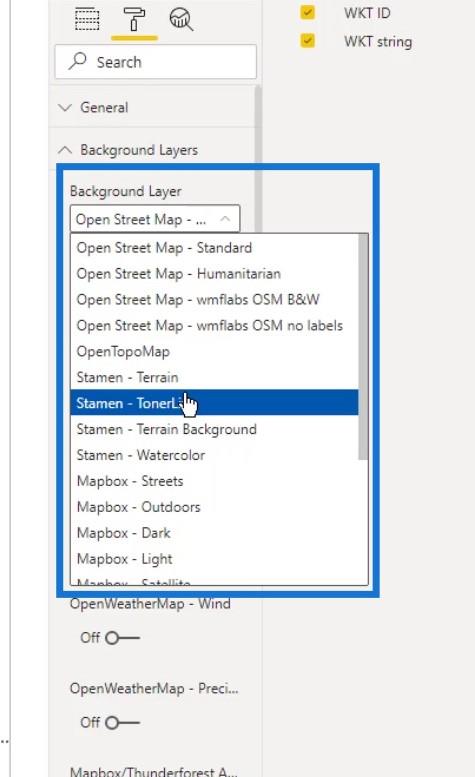
I selected this map because it’s nice and gray. It also gives a good reflection of the colors that I want to use.
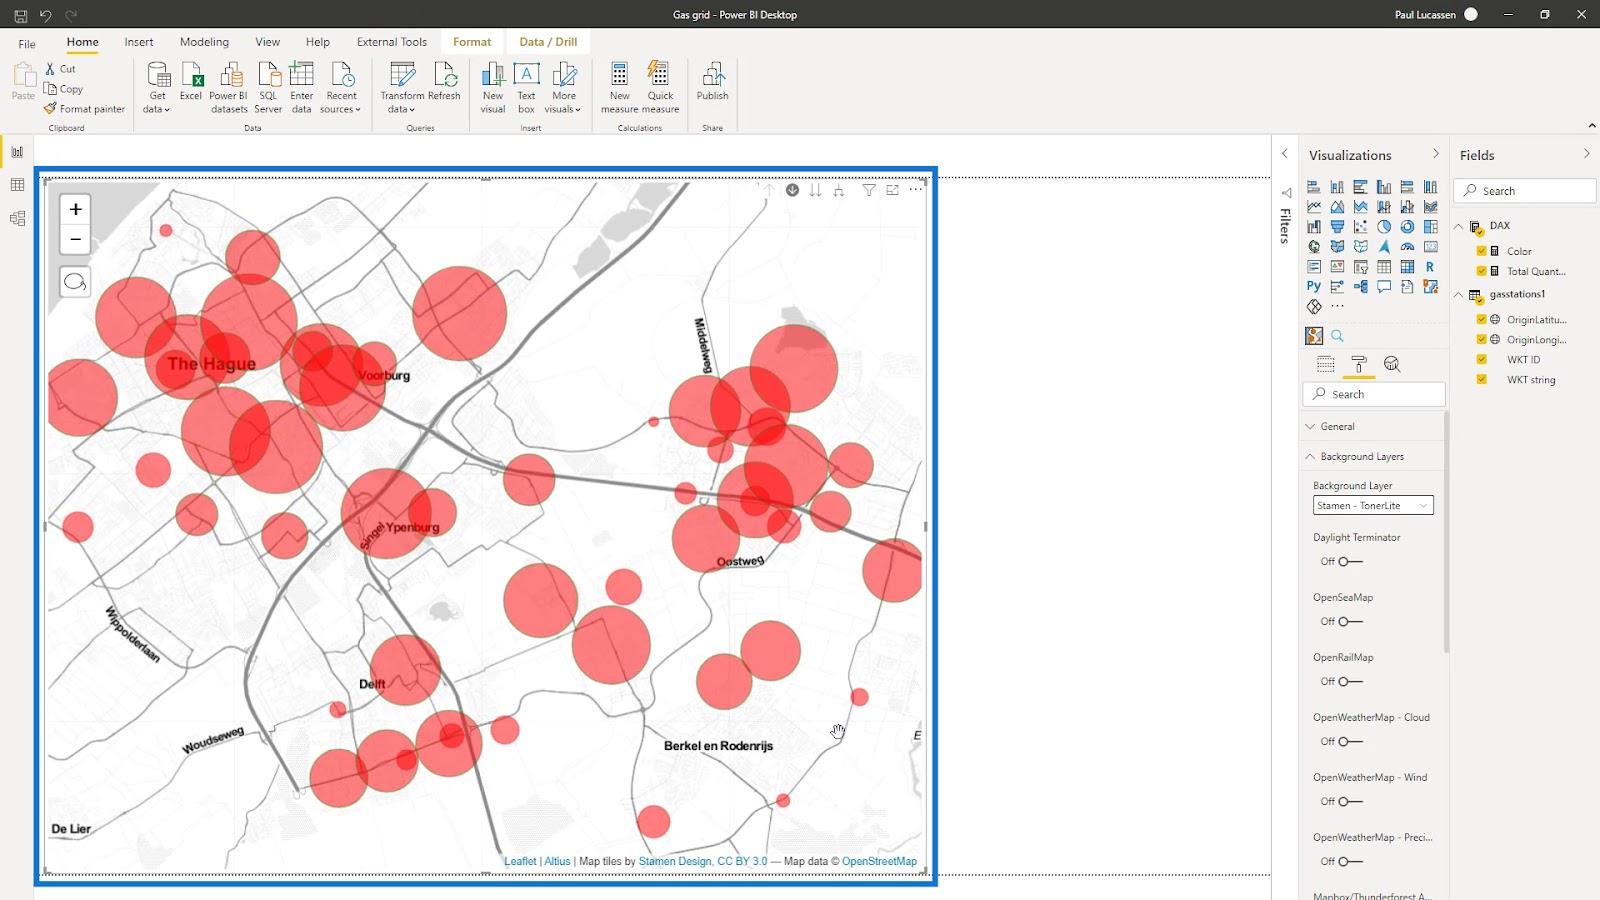
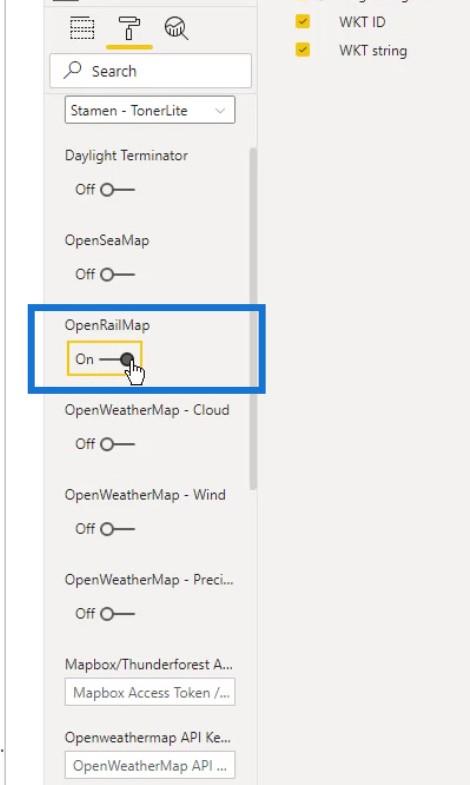
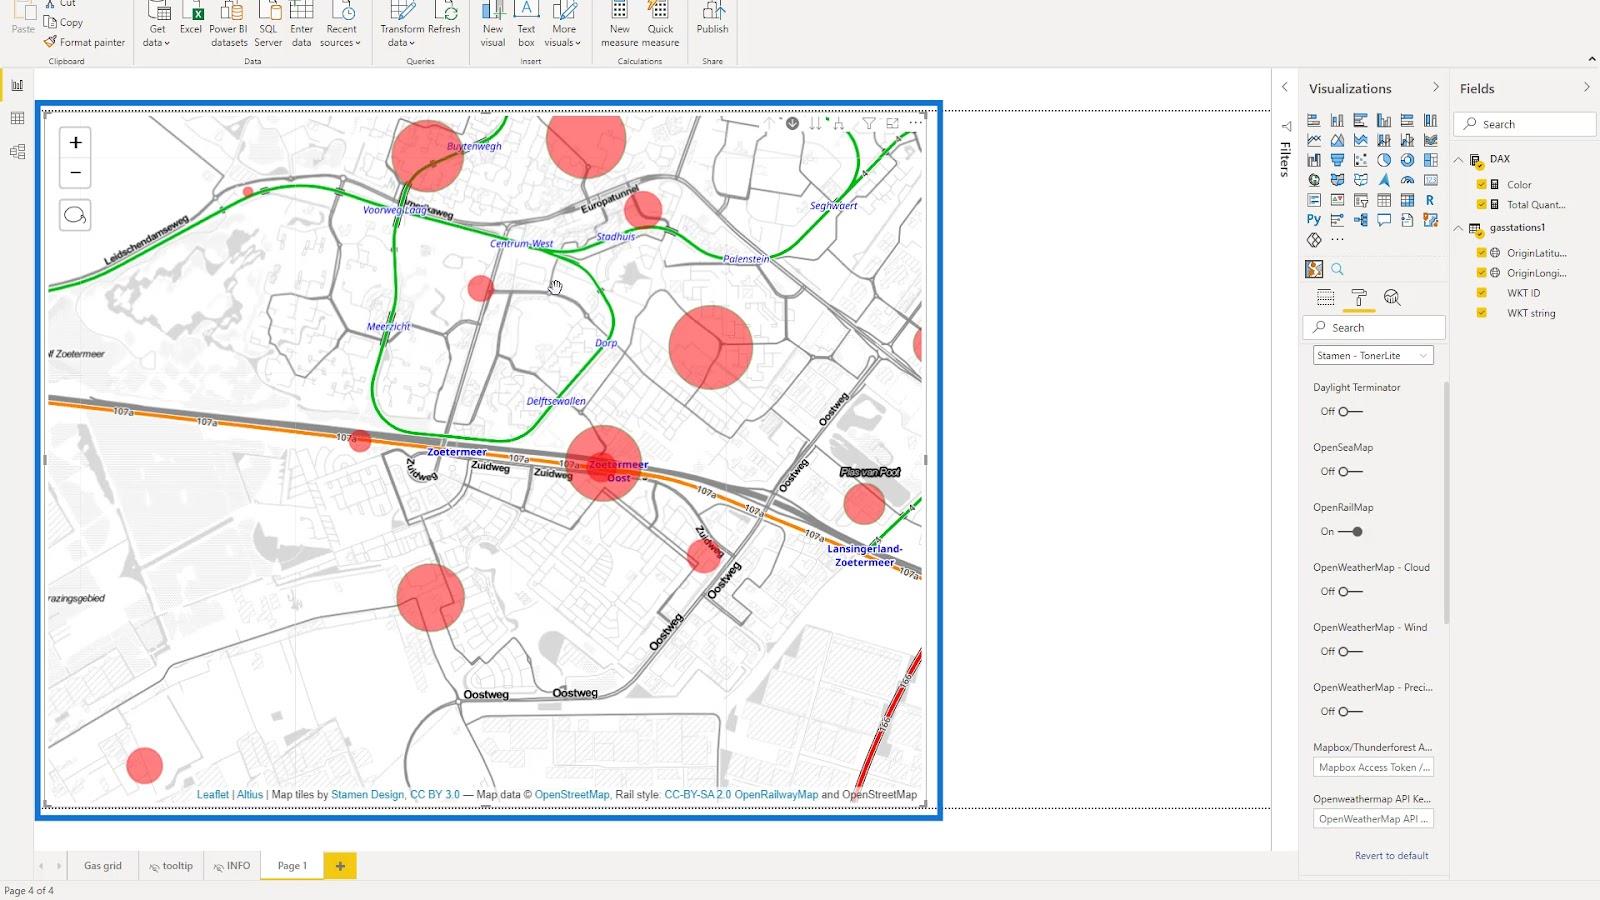
There are also different options for layers here. For instance, I’ll enable the OpenRailMap here.
This will then add railway lines (represented in orange color) on the map.
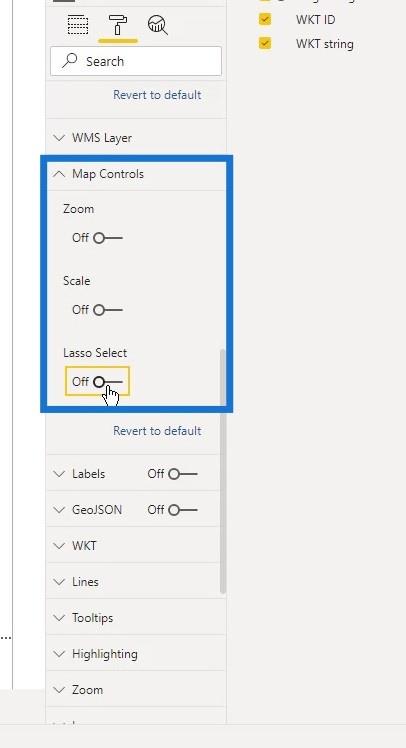
Under the Map Controls, I’ll disable the Zoom and Lasso Select options to make the map cleaner.
Then, I’ll turn on the Labels option here.
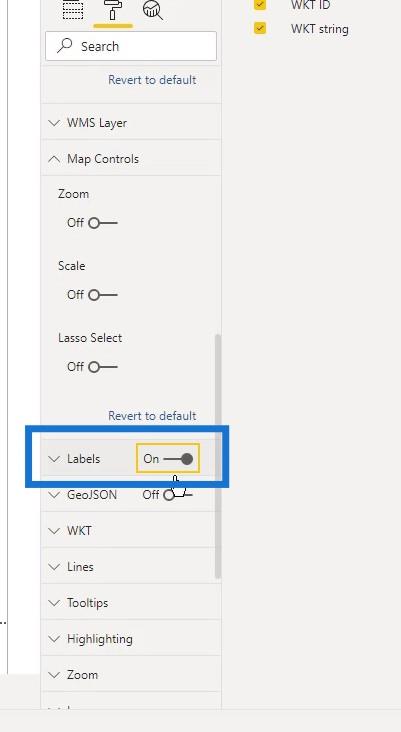
Here you can see the labels which are referring to the station or the section of the pipeline.
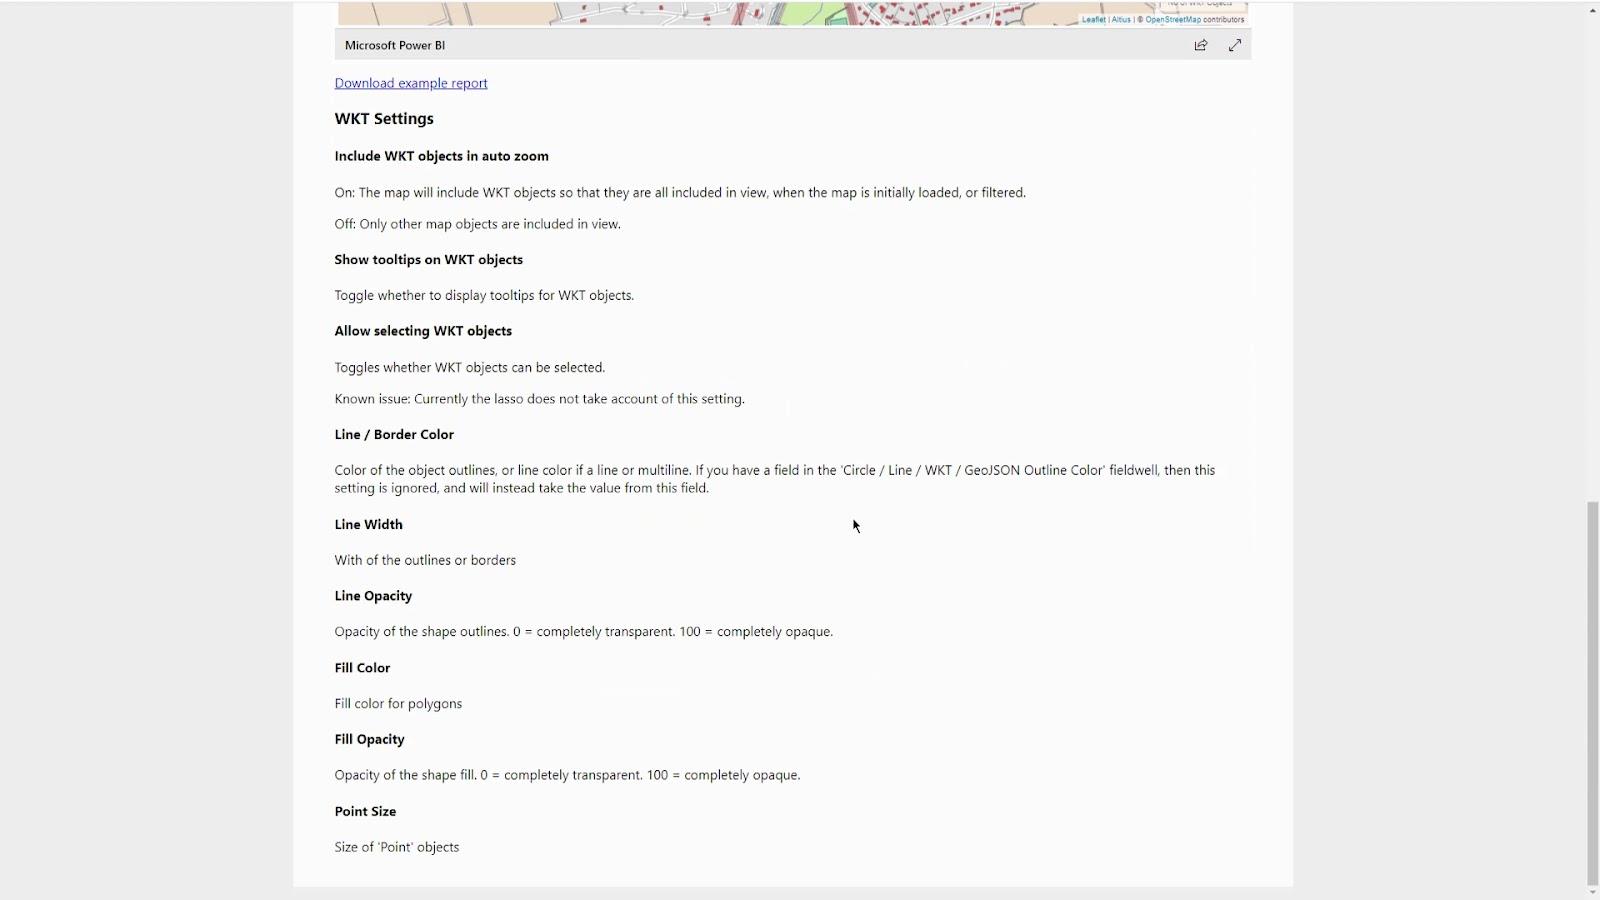
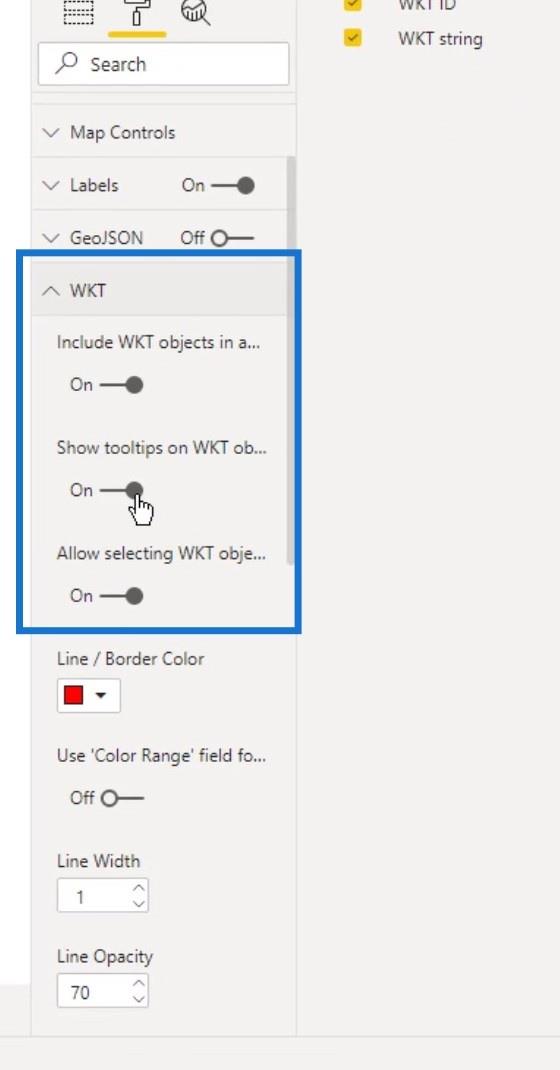
I selected all the options under the WKT as well because they also have an impact on the map display.
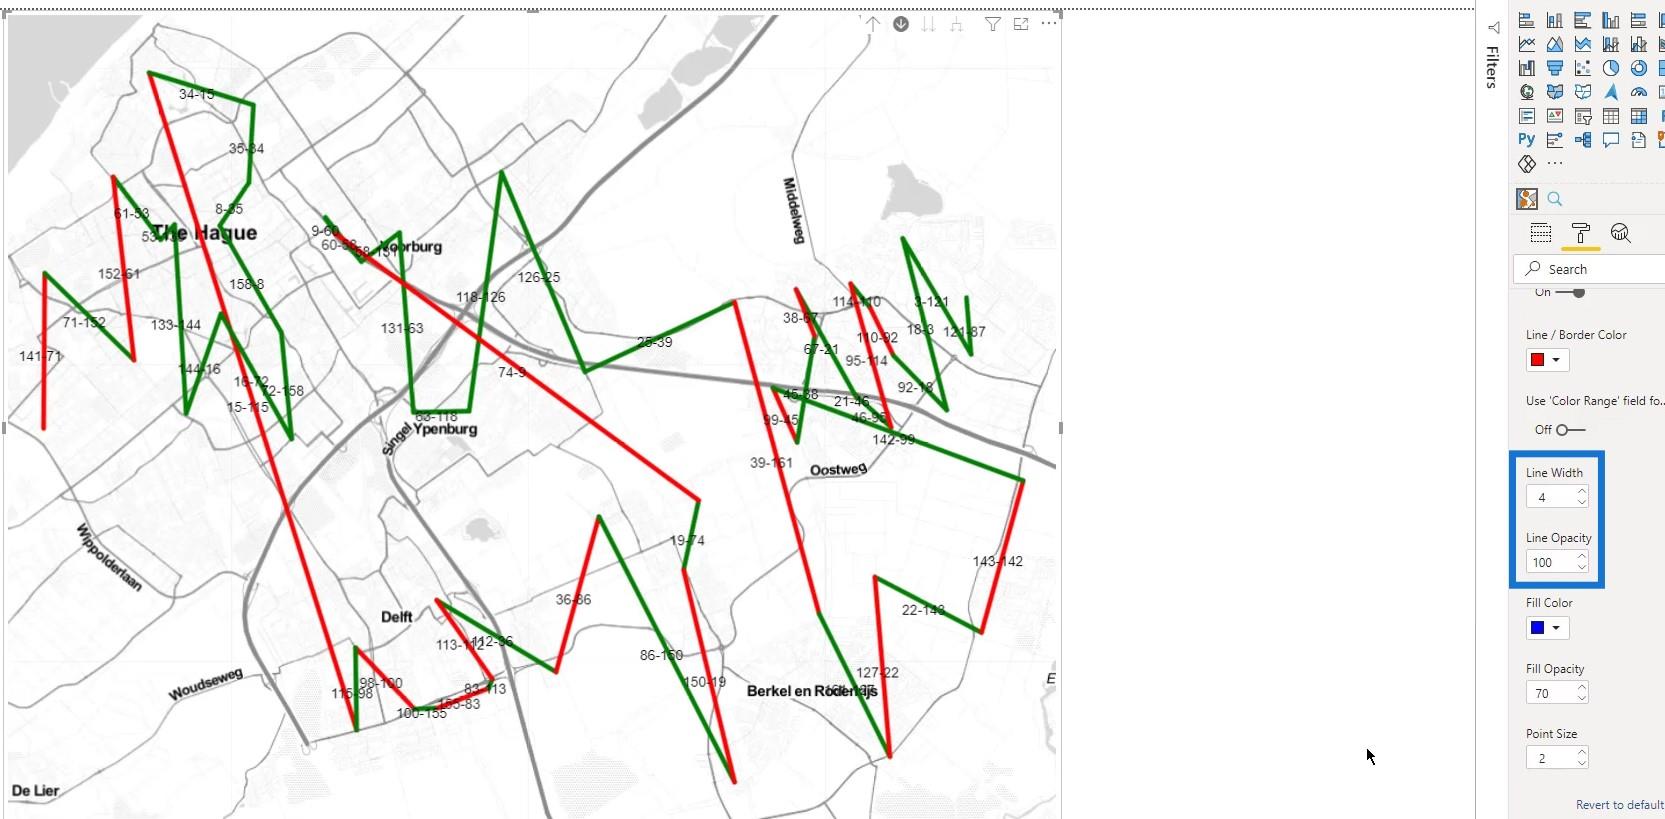
I also increased the thickness of the lines for the line layers by increasing the value of the Line Width here. Furthermore, I changed its Opacity to 100% to make it stand out.
I was able to control the Tooltips here. In this example, I’ll leave it to the default setting.
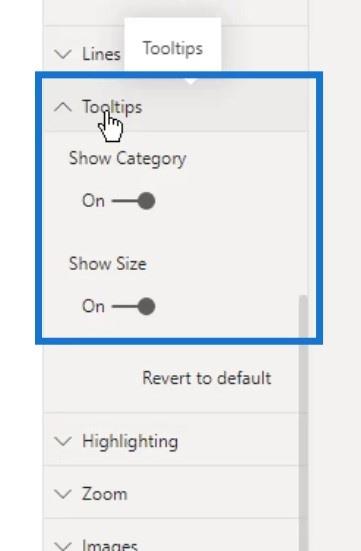
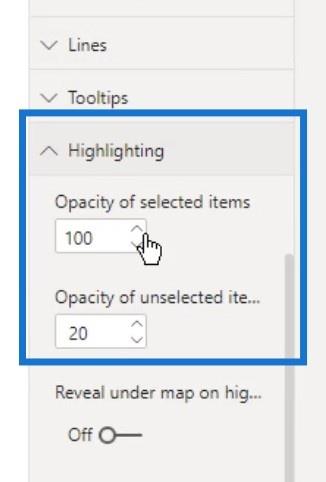
Under the Highlighting, I’ve set different values for the Opacity of selected items, and the Opacity of unselected items.
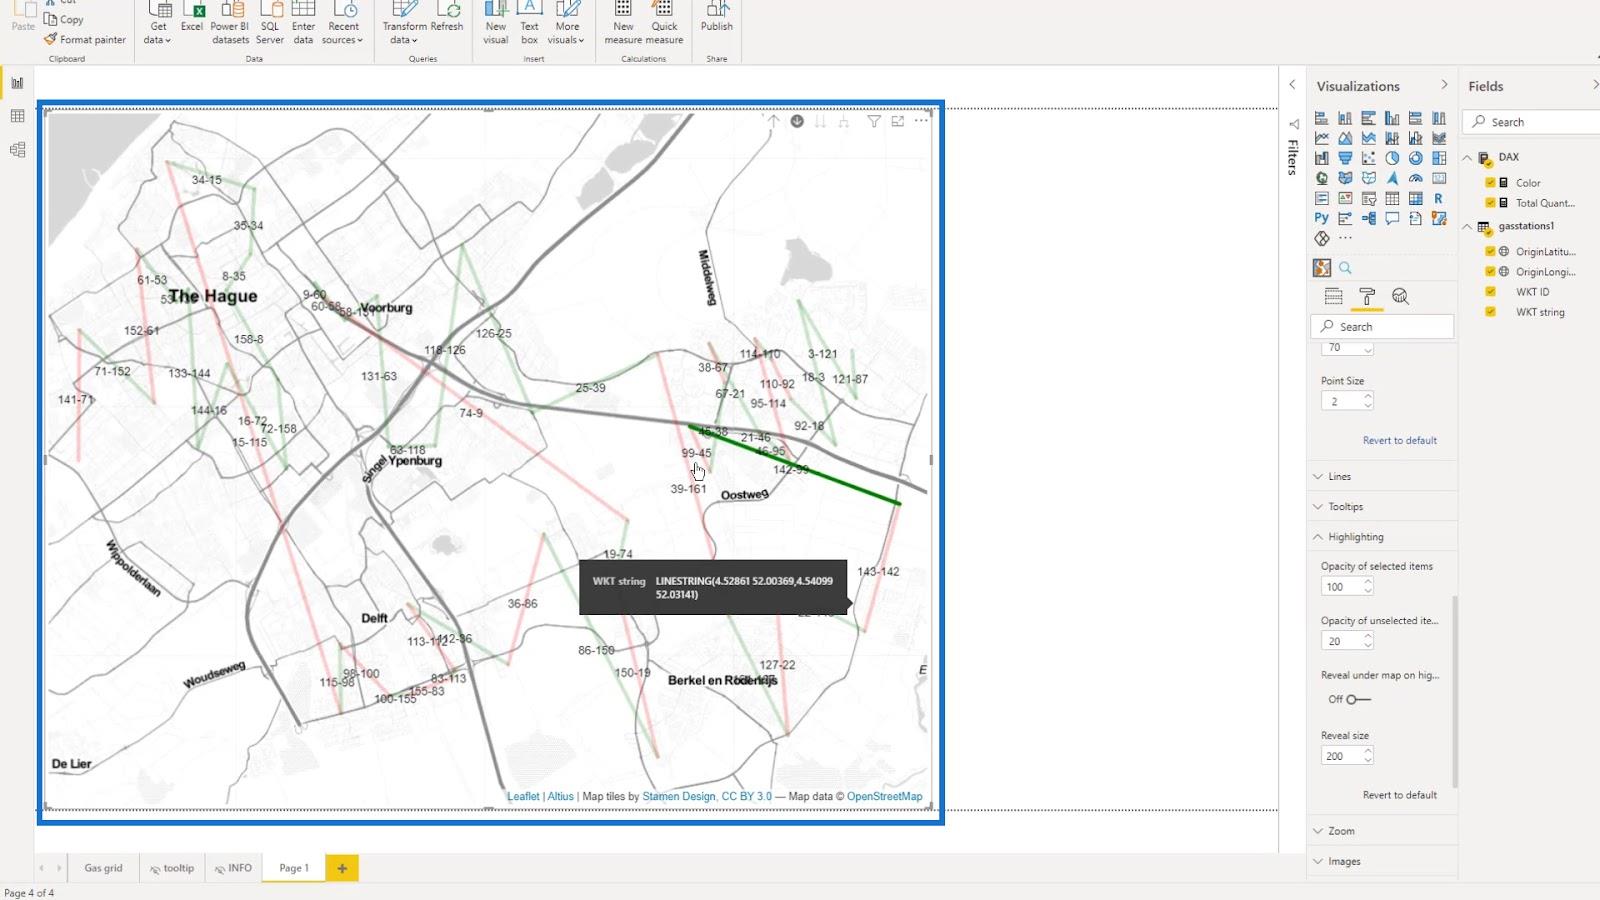
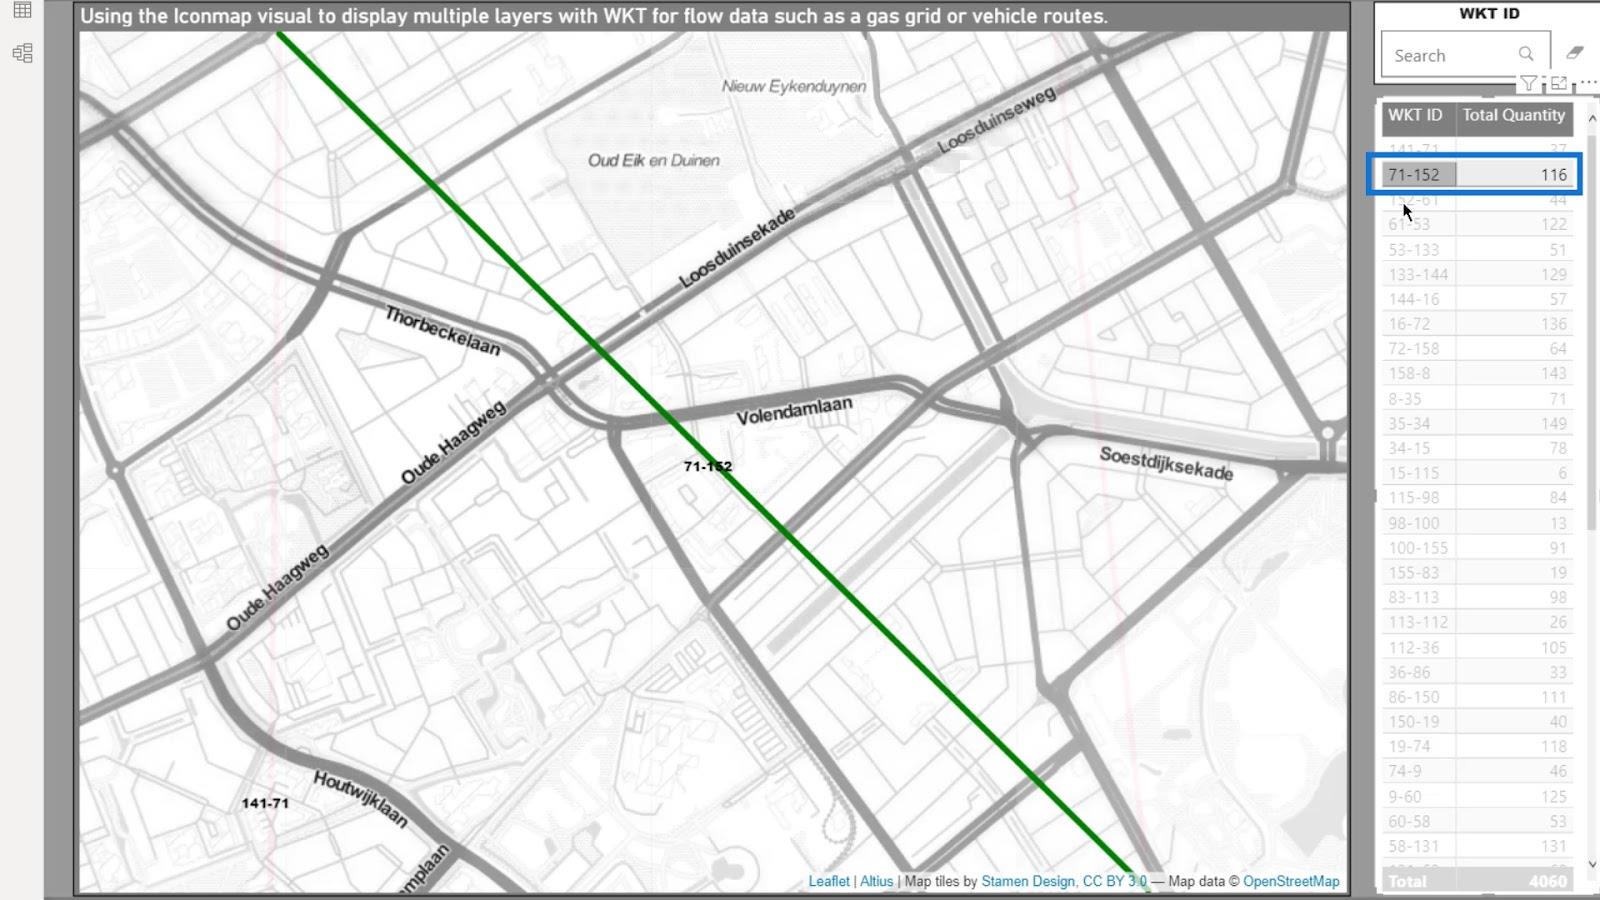
This is how it looks like when selecting one line on the map. You can see that the other lines are still visible because the opacity of the unselected is set to 20.
By changing the opacity of the unselected to 1, they will be completely invisible.
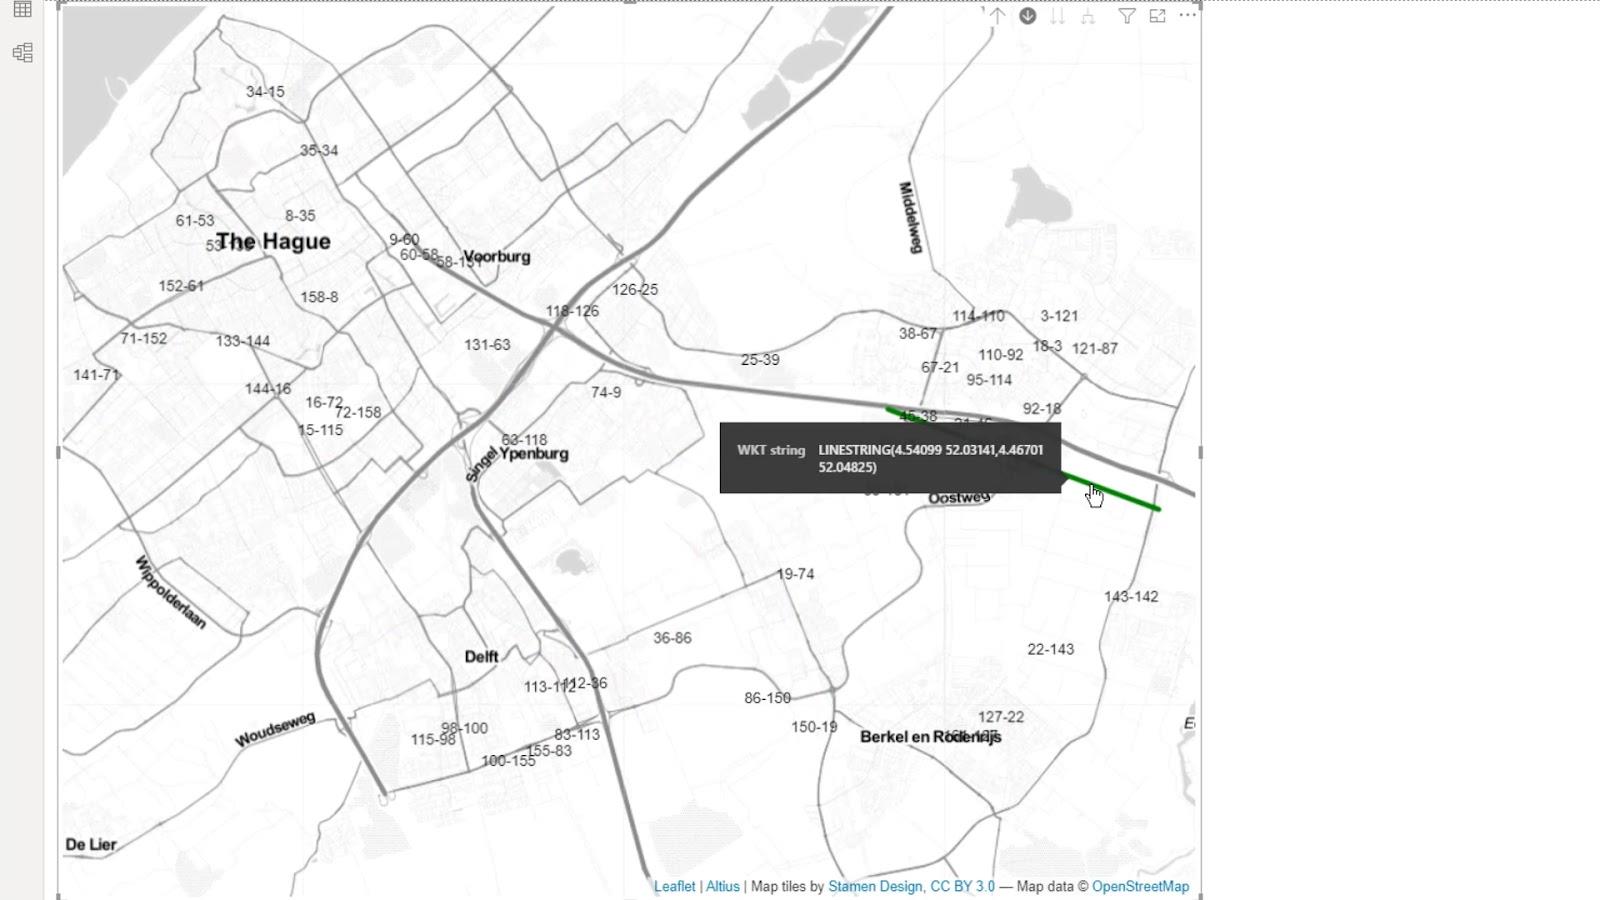
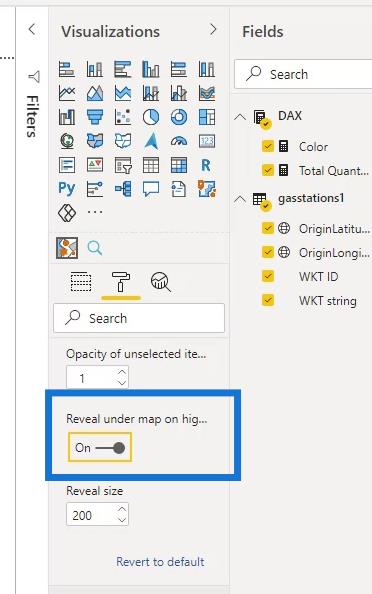
I also enabled the Reveal under map option because I might be able to use it under certain circumstances.
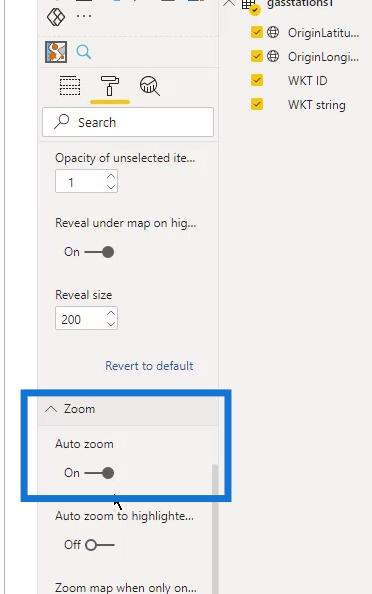
Then I enabled Auto zoom.
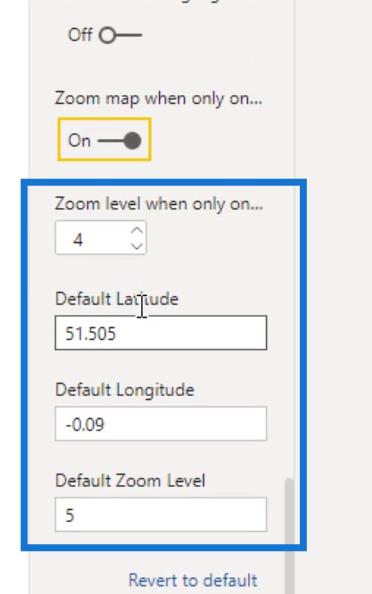
There are also other available settings that I can try and play around.
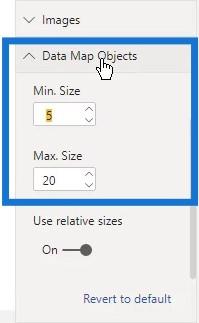
The size of these circles on the map can also be changed. Under the Data Map Objects, just change the Min. Size for the minimum size and the Max. Size for the maximum size.
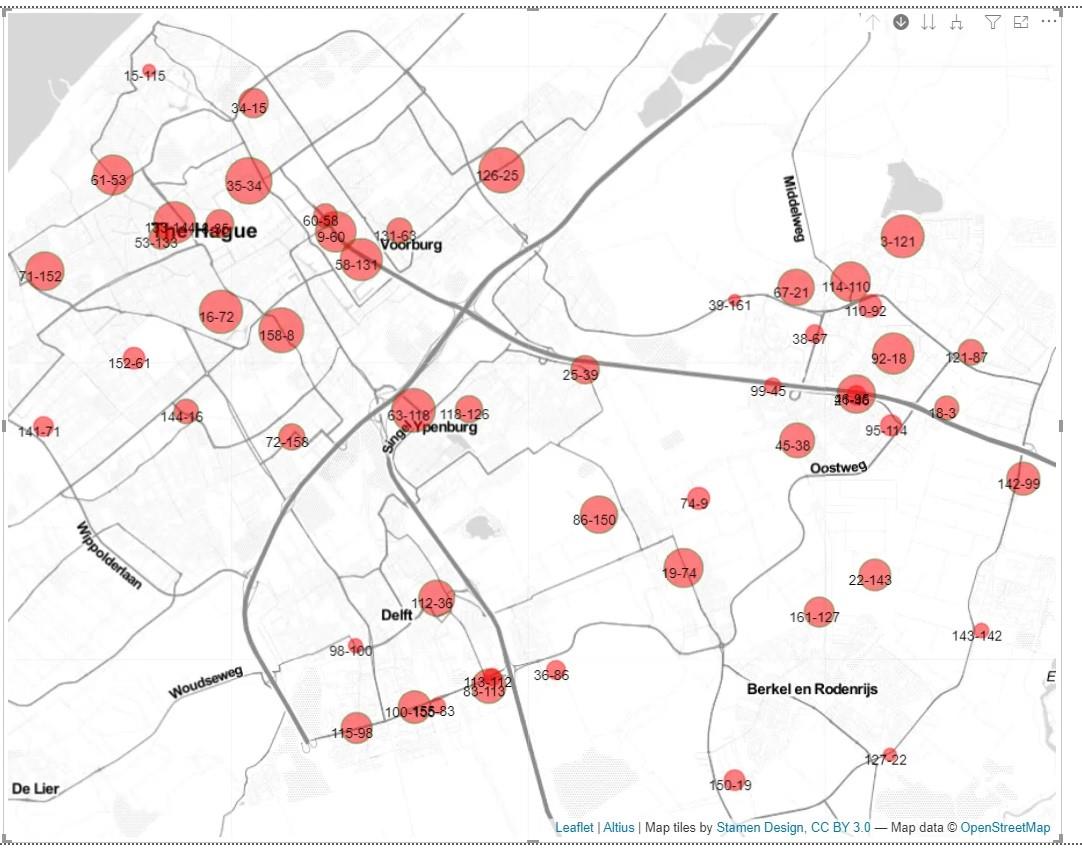
In this example, I used 20 for the maximum size, and 3 for the minimum size.
8. Adding A Tooltip
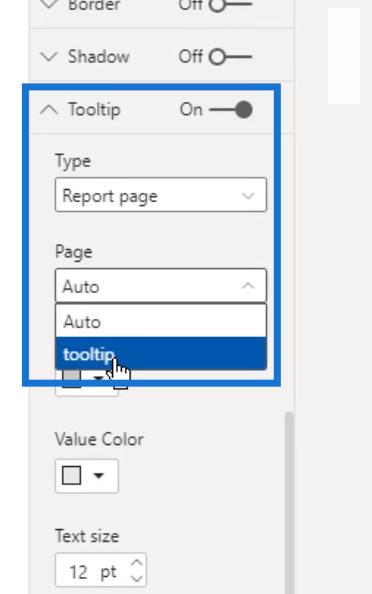
I created a simple tooltip that looks like this.

I was able to use that tooltip here. Under the Type option, I selected the tooltip option which is the name of the tooltip that I created. Note that this Tooltip option here is different from the Tooltips that I previously mentioned.
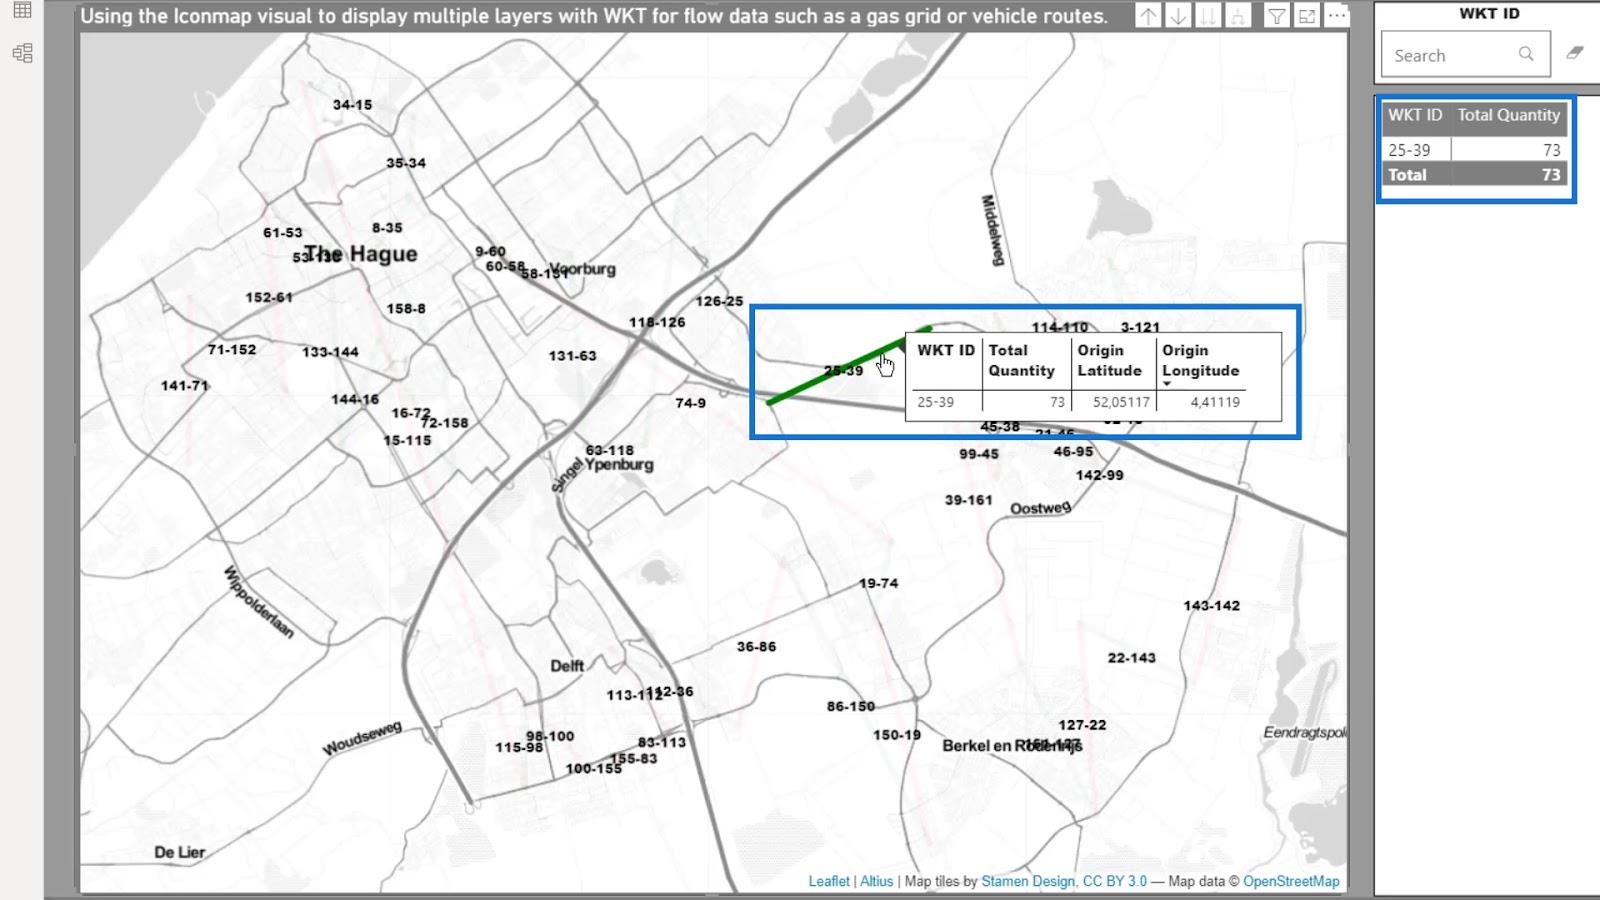
After that, as I hover over my map, you can see the tooltip that I created.
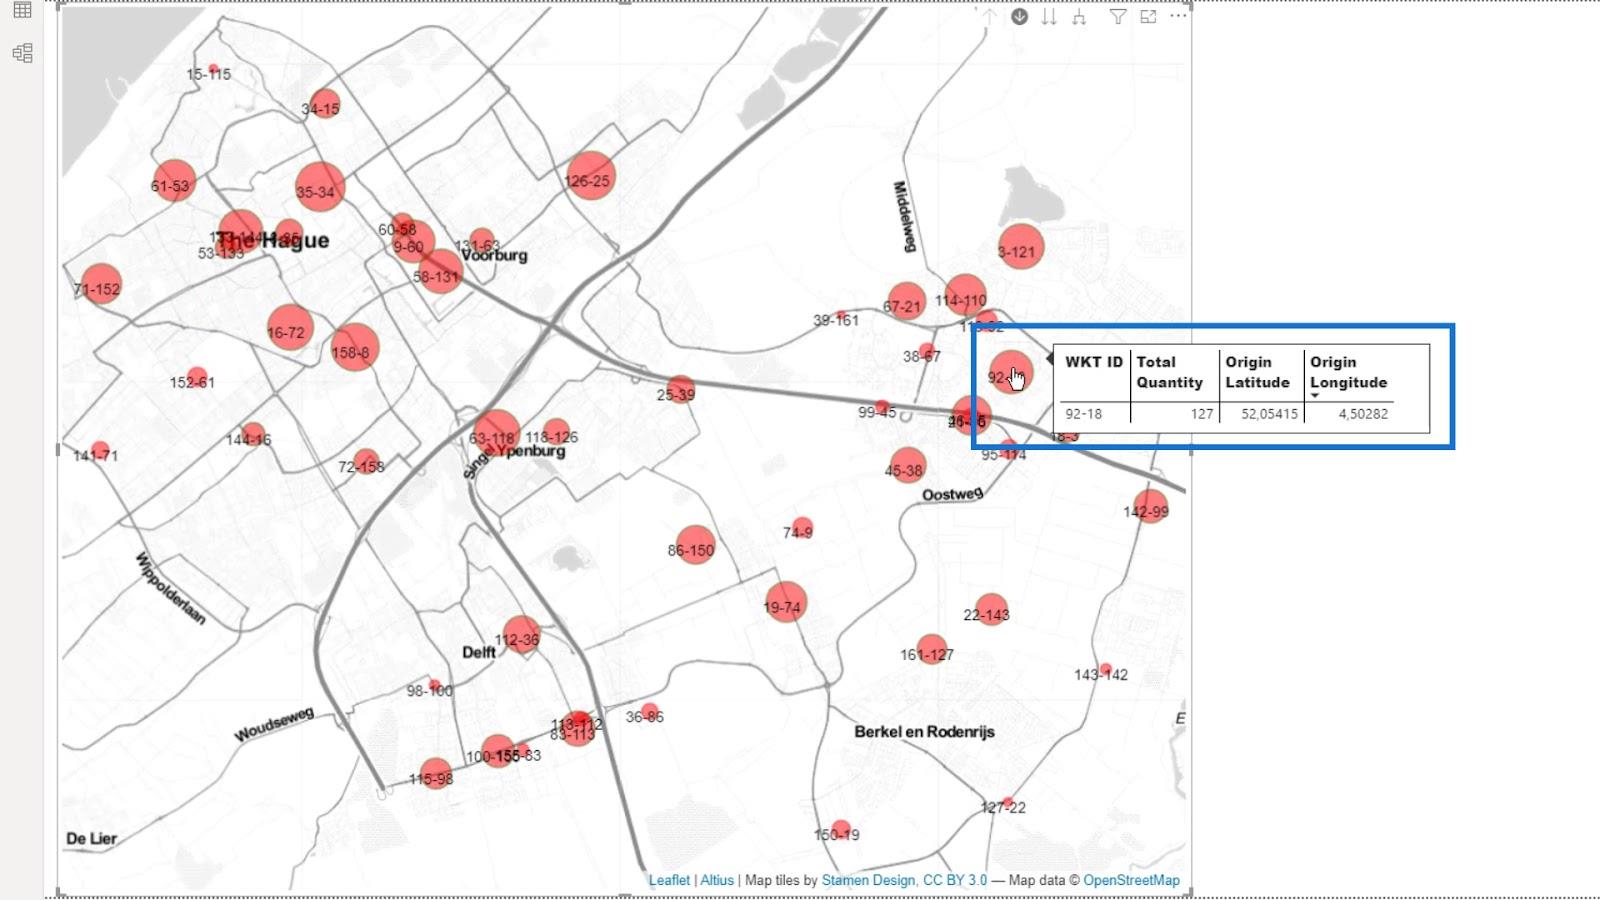
Depending on the map that you are creating, the other settings might not be relevant. As you can see, the settings might be overwhelming, but they all contribute to a better map appearance.
9. The Output
Now, I have a map that can show multiple layers. I can switch between the stations that I can display as circles or lines.
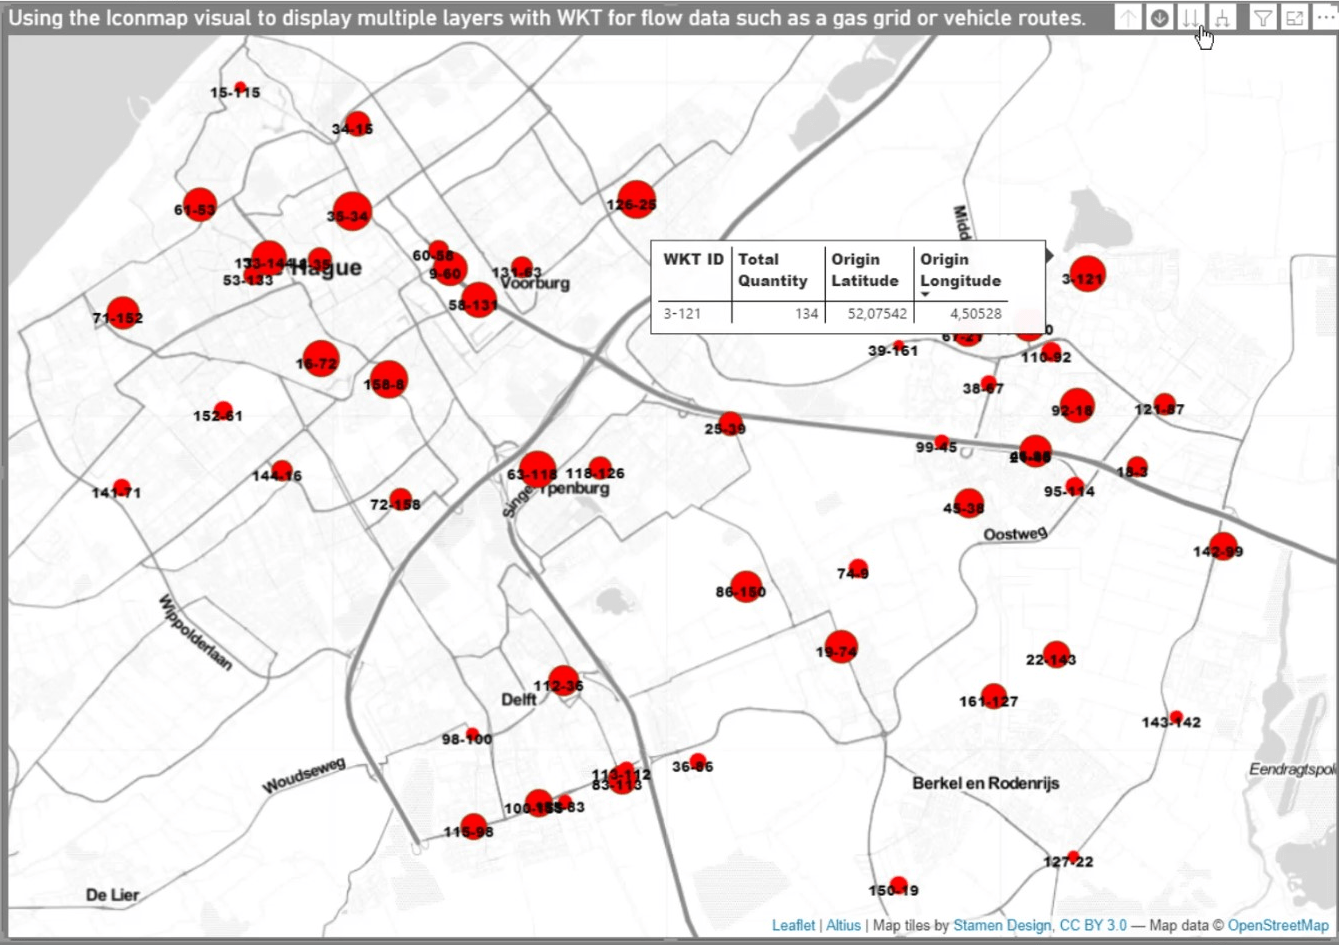
After completing the previous steps, it’s now possible to add a table to reflect the selections that you are making in the map.
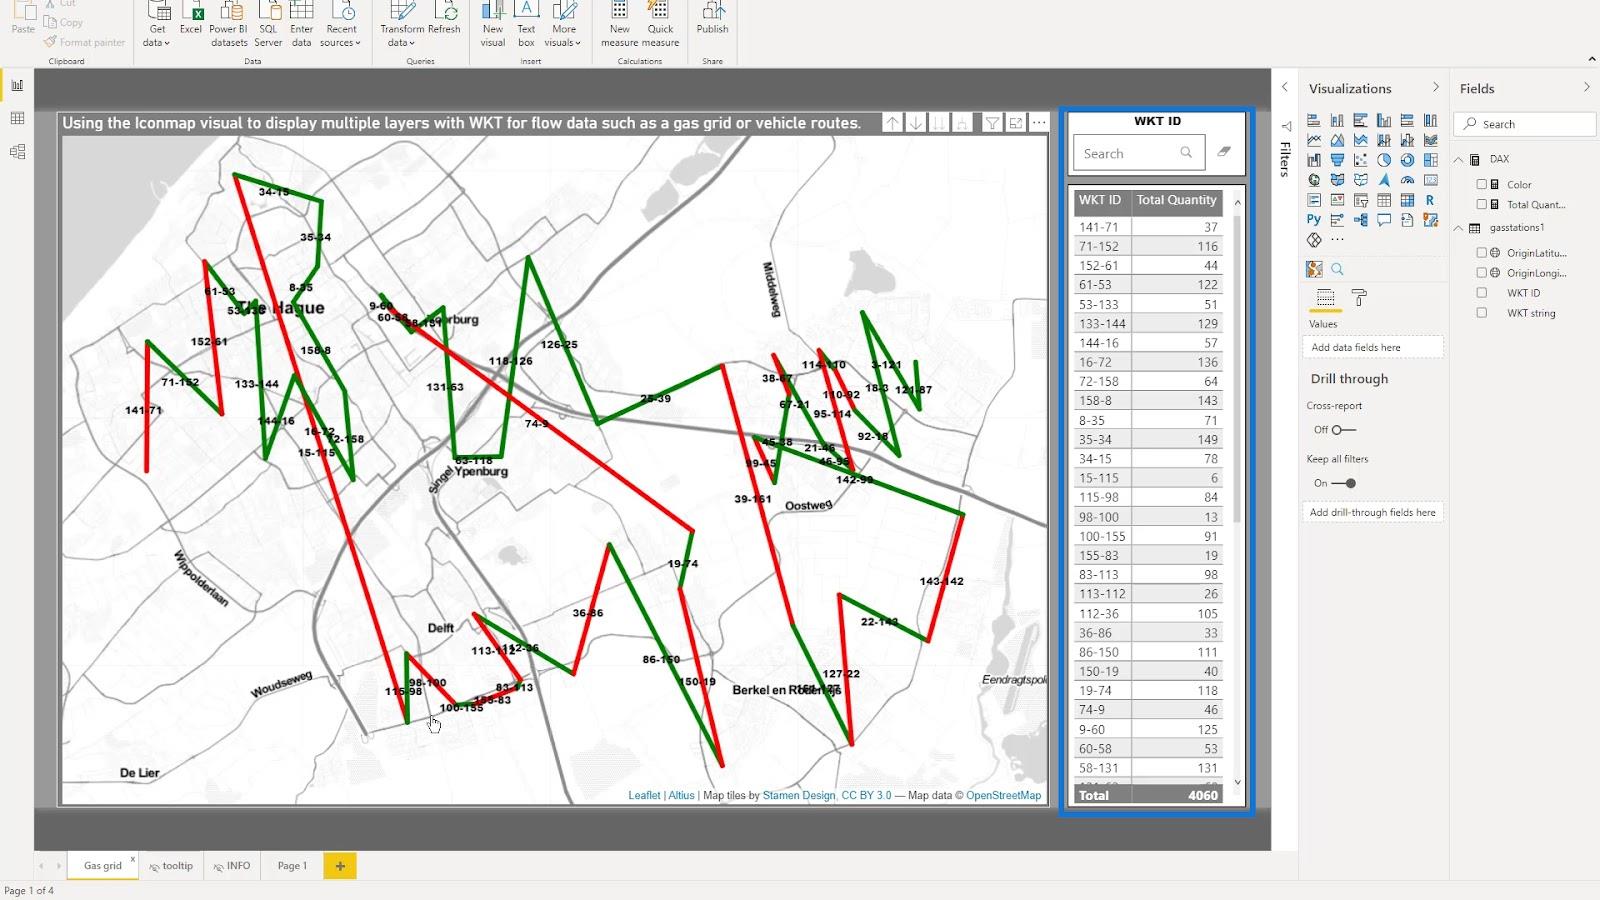
In this example, I can select a point here, and it will show that point on the map.
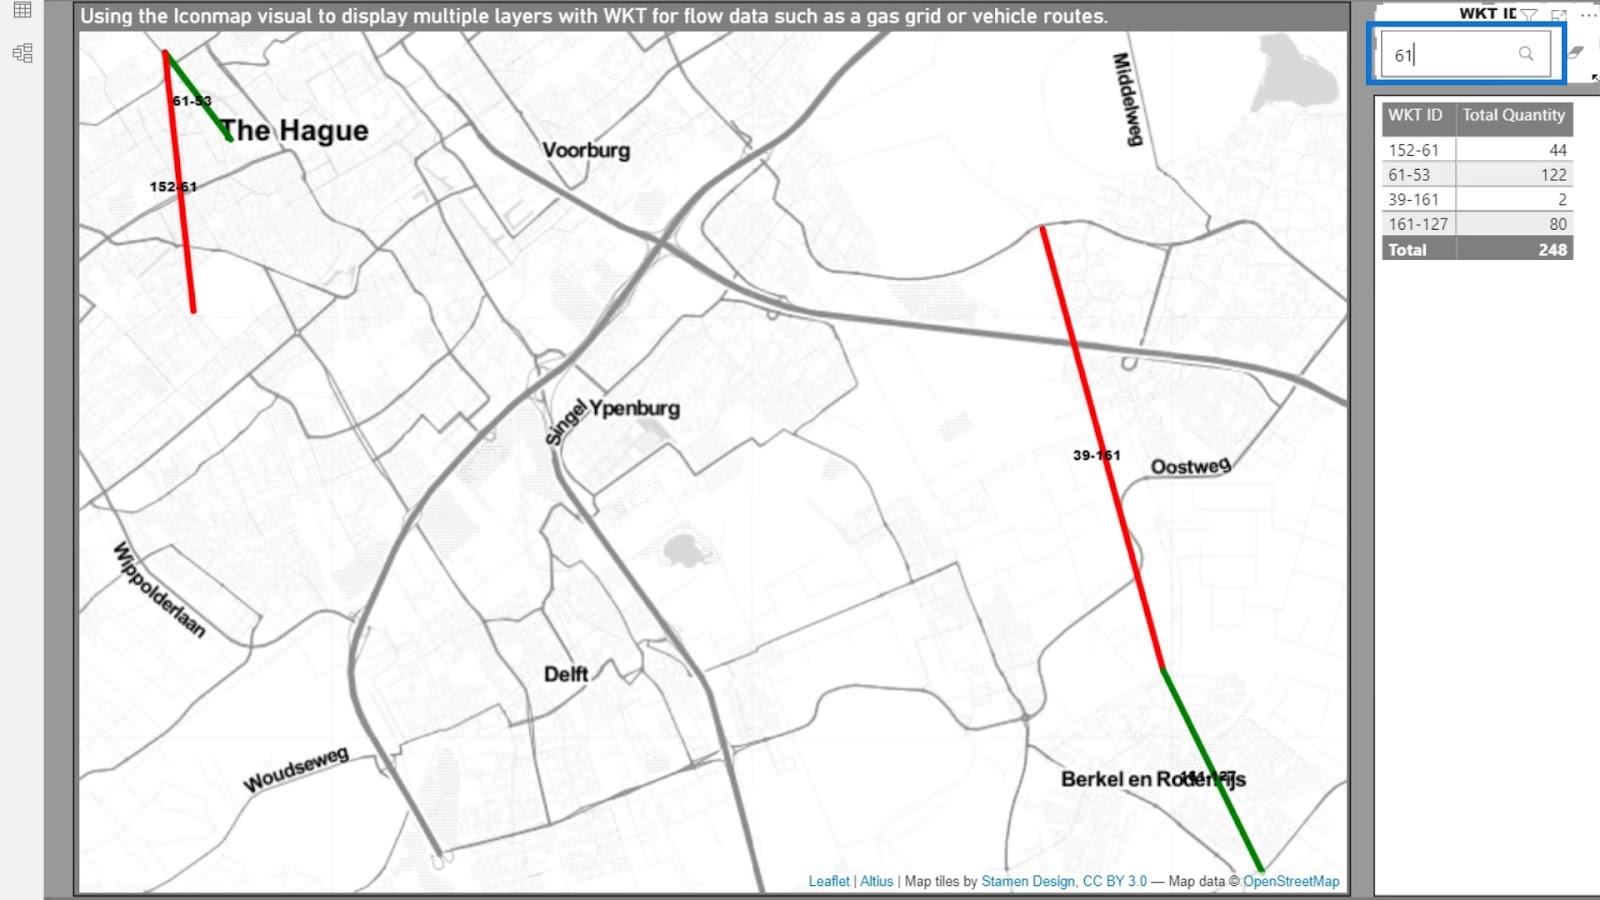
I can also use the search feature here. For example, If I type 61, it will also show those points on the map.
Lastly, I can just select an item on the map by just clicking on it. Then, it will be displayed on the table.
That wraps up the first part of this Well Known Text tutorial.
Sample LuckyTemplates Icon Map Scenario Based On Delivery Routes
In this second example, I’m looking at delivery routes. Again, most of the work is done in Power Query. The way I handled the data in the first example is not very different from what I used in this example. But I still have completely different data in this example.
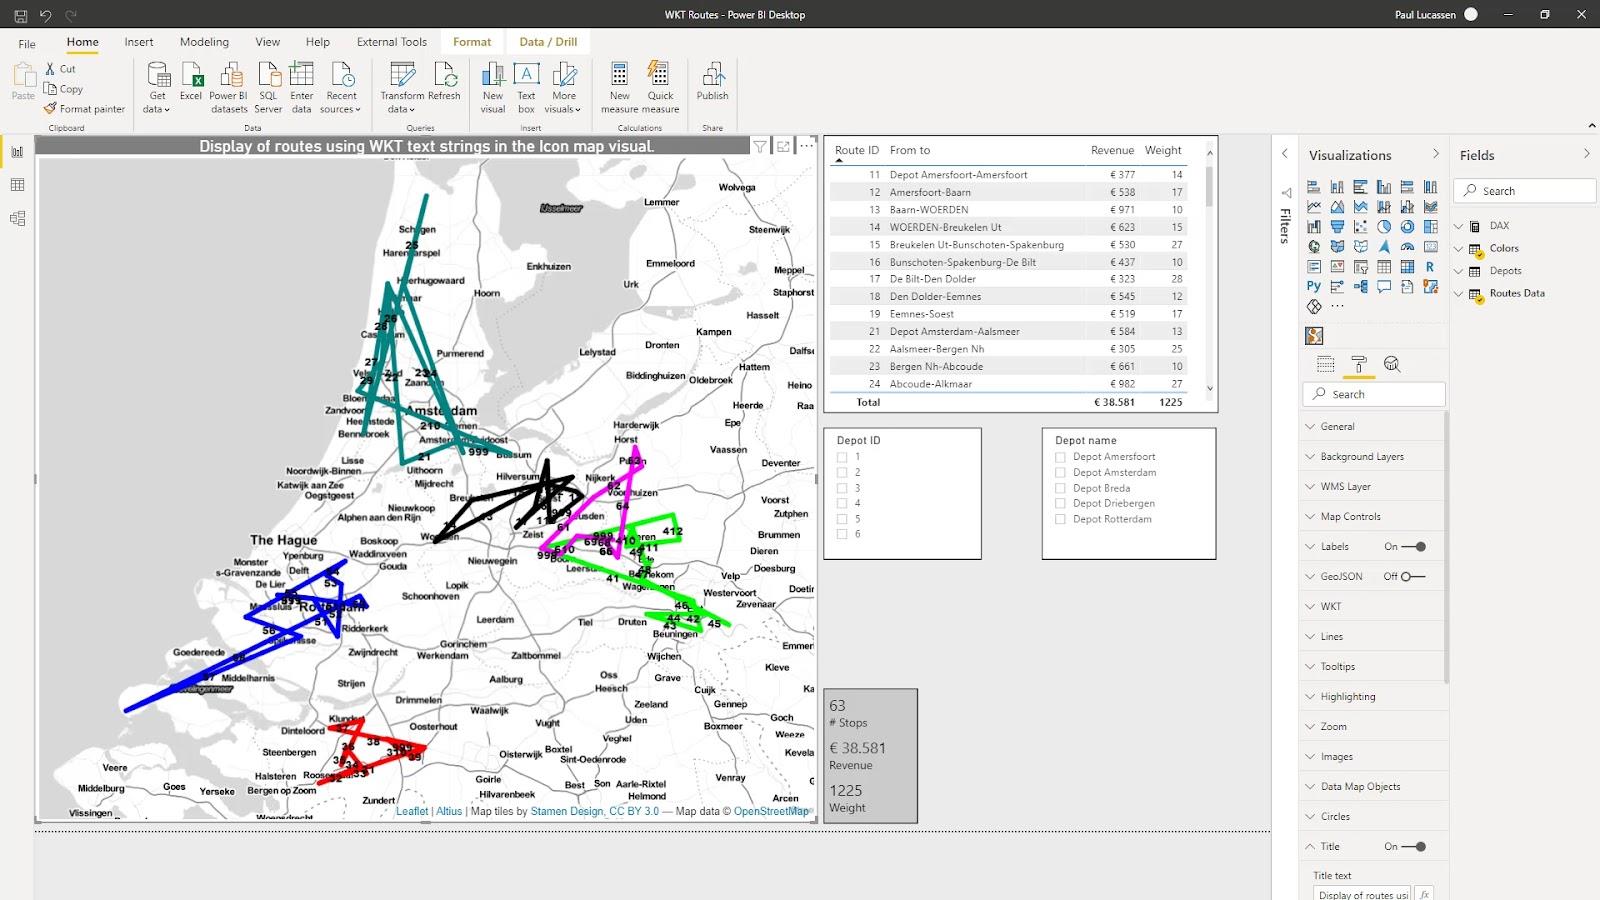
In this second example, I want to analyze the routes from several vehicles that are from varying depots. Then, display them as straight lines connecting the from and to locations in each delivery route.
Depending on what is available in your data, you could analyze the emission per stop, the fuel consumption, the stop time, and many more. This example will only show weight and revenue.
One of my current projects seeks to calculate the emissions across multiple type of vehicle routes and the various circumstances. This required a transportation tender response.
1. The Dataset
ข้อมูลที่ฉันใช้มาจากระบบการจัดการการขนส่ง มีหลายวิธีที่ข้อมูลอาจพร้อมใช้งาน อาจมาจากระบบการจัดการการขนส่งประเภท ต่างๆ จากโปรแกรมเพิ่มประสิทธิภาพเส้นทางหรือจากบอร์ดคอมพิวเตอร์
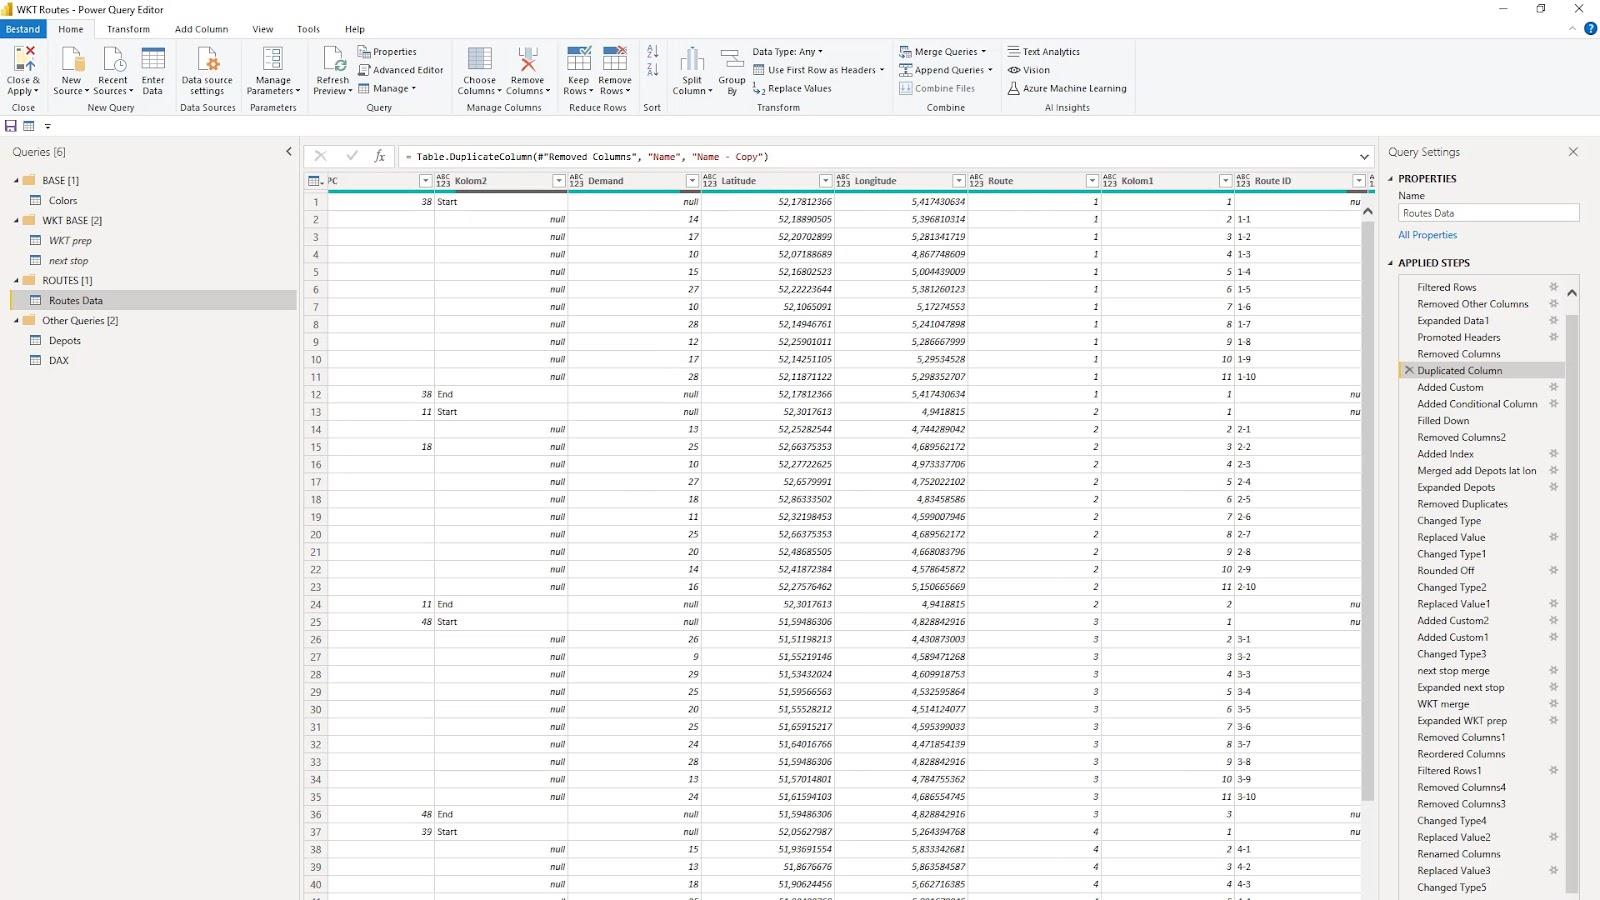
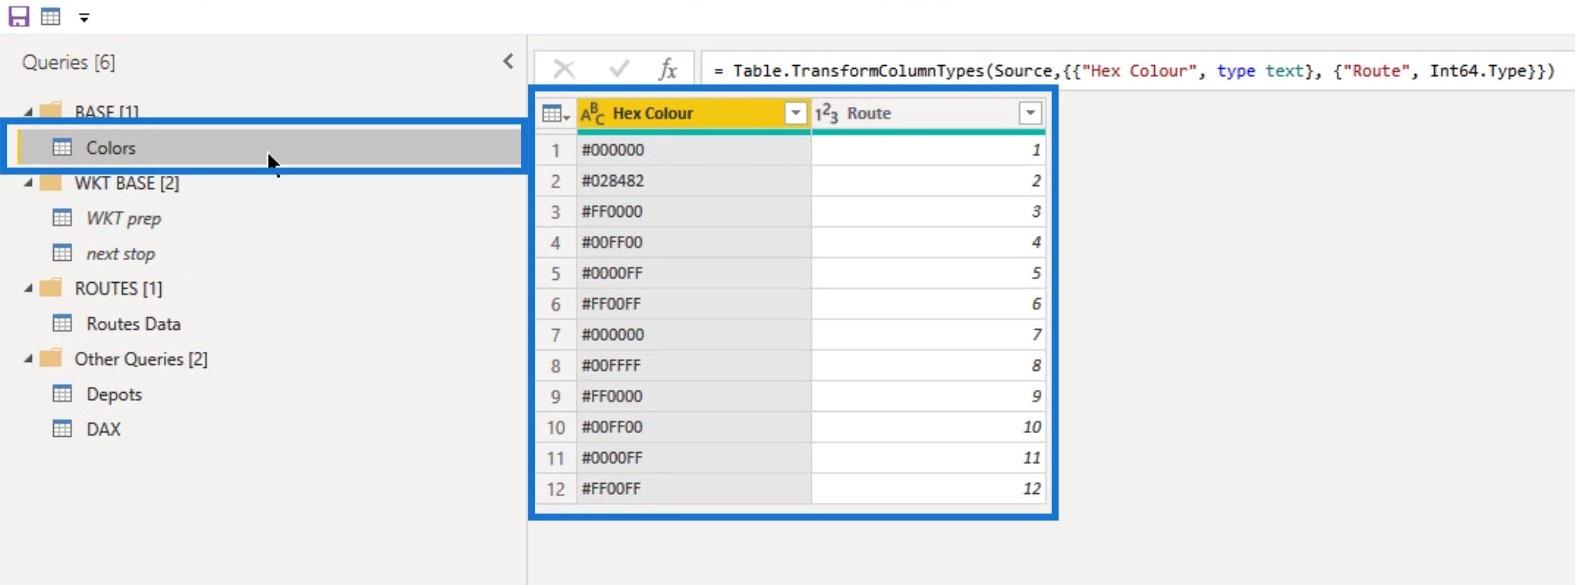
ใน Power Query ขณะนี้ฉันมีคำถามห้าข้อ อันดับแรกคือ ตาราง สีเพื่อควบคุมการแสดงสีสำหรับเส้นทาง
ฉันยังมีแบบสอบถามสองรายการที่ซ้ำกับแบบสอบถามข้อมูลเส้นทางที่เป็นส่วนหนึ่งของการแปลงข้อมูล Power Query ฉันตั้งชื่อพวกเขาว่า WKT prep ( การเตรียมข้อความที่รู้จักกันดี ) และจุดถัดไป ( การเตรียมจุดถัดไป ) ทั้งสองนี้ใช้เพื่อผสานข้อมูลที่จำเป็นกับการสืบค้นข้อมูลเส้นทาง หลัก

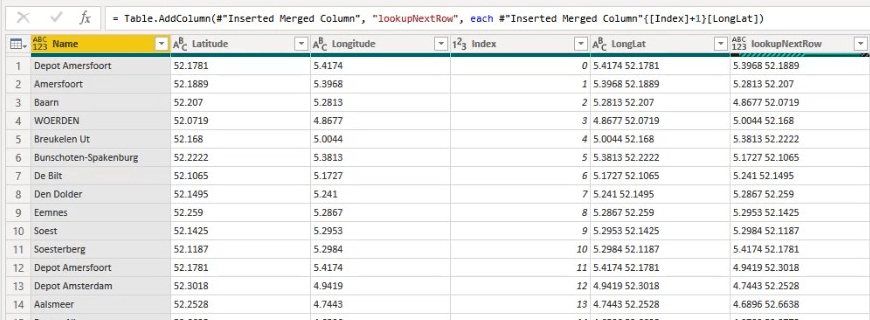
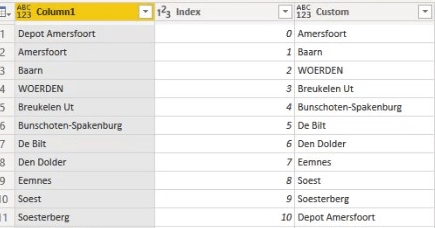
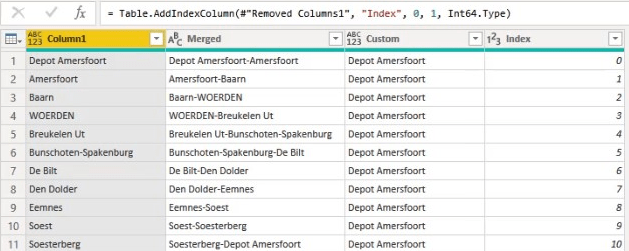
There are a few ways on how to complete one of the key requirements in this case. And that is getting the name, the latitude, and the longitude of the next row into the previous row to show the sequence of the delivery.
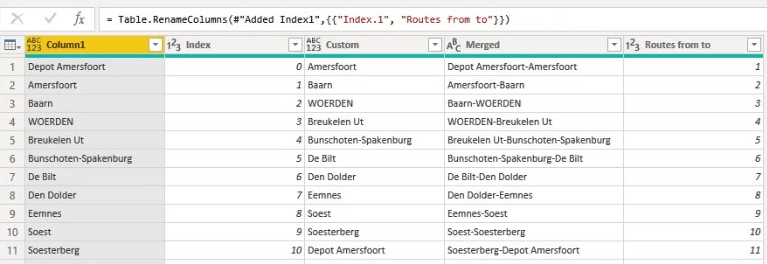
Next is to show the departing and arriving depot in the correct columns.
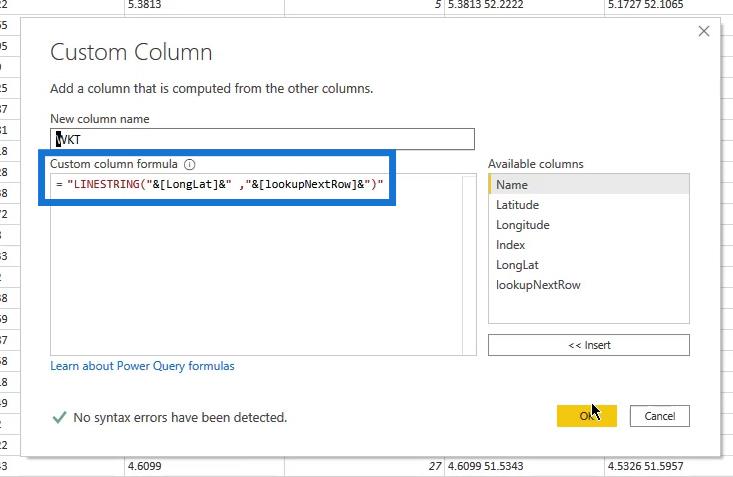
Lastly, I created a Well Known Text string.
I used both the index methods and merging with shifted indexes zero to one or one to two to align the records. I also utilized a custom column solution where the index number plus 1 will return the next row.
This may incur memory issues in bigger datasets.
So, using the methodology to merge based on the index column is preferable as it is much more simple.
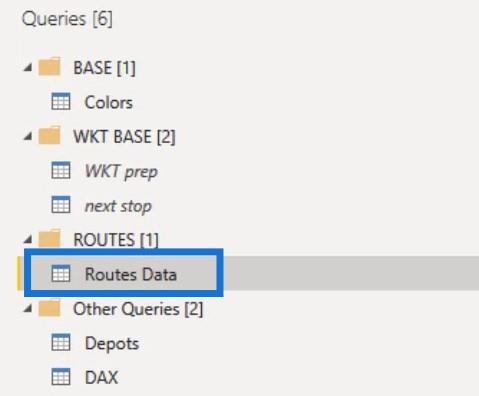
I also have the Routes Data query. This will be loaded into the model.
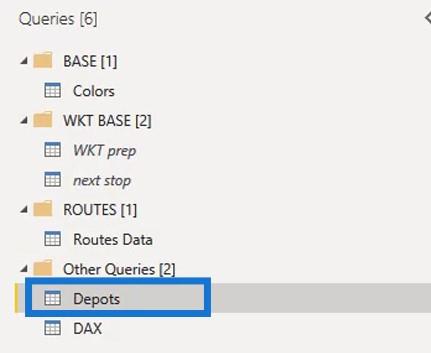
The Depots query contains information regarding the start and endpoint of each route. I also merged this query with the Routes Data query.
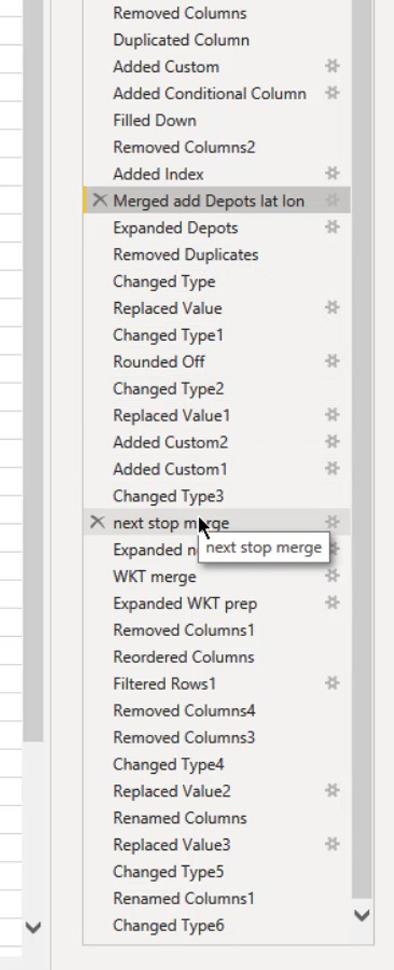
The model and underlying data will be available for reference. I suggest walking through the applied steps at your own pace from merging the Depots query to get the latitude and longitude. Then proceed to the step for the next stop merging in order to add the Well Known Text to the data. After that, you can move on to doing the steps for final cleanup.
I loaded the Depots, Colors, and Routes Data tables. I also created a connection in the data model.
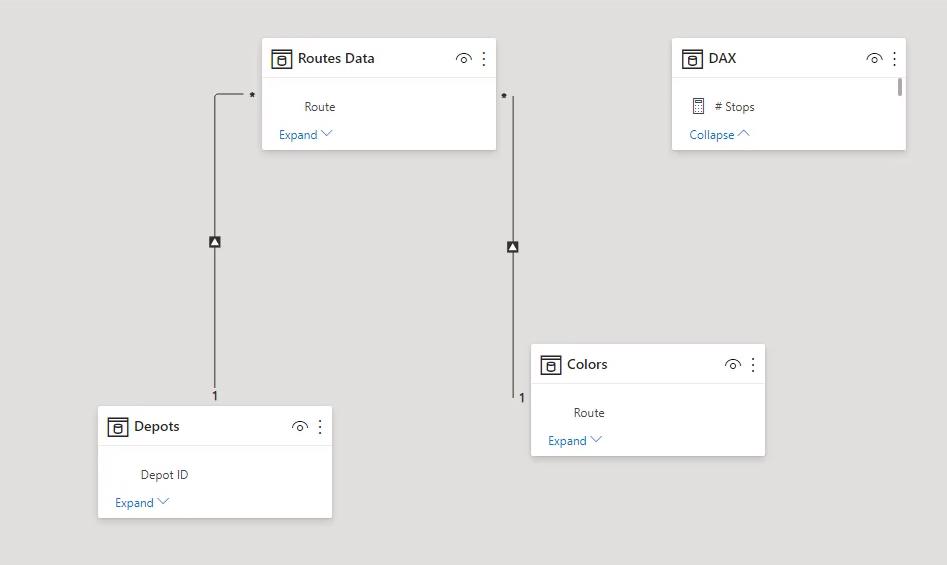
So, I can now start with the visualization.
2. Icon Map Visualization
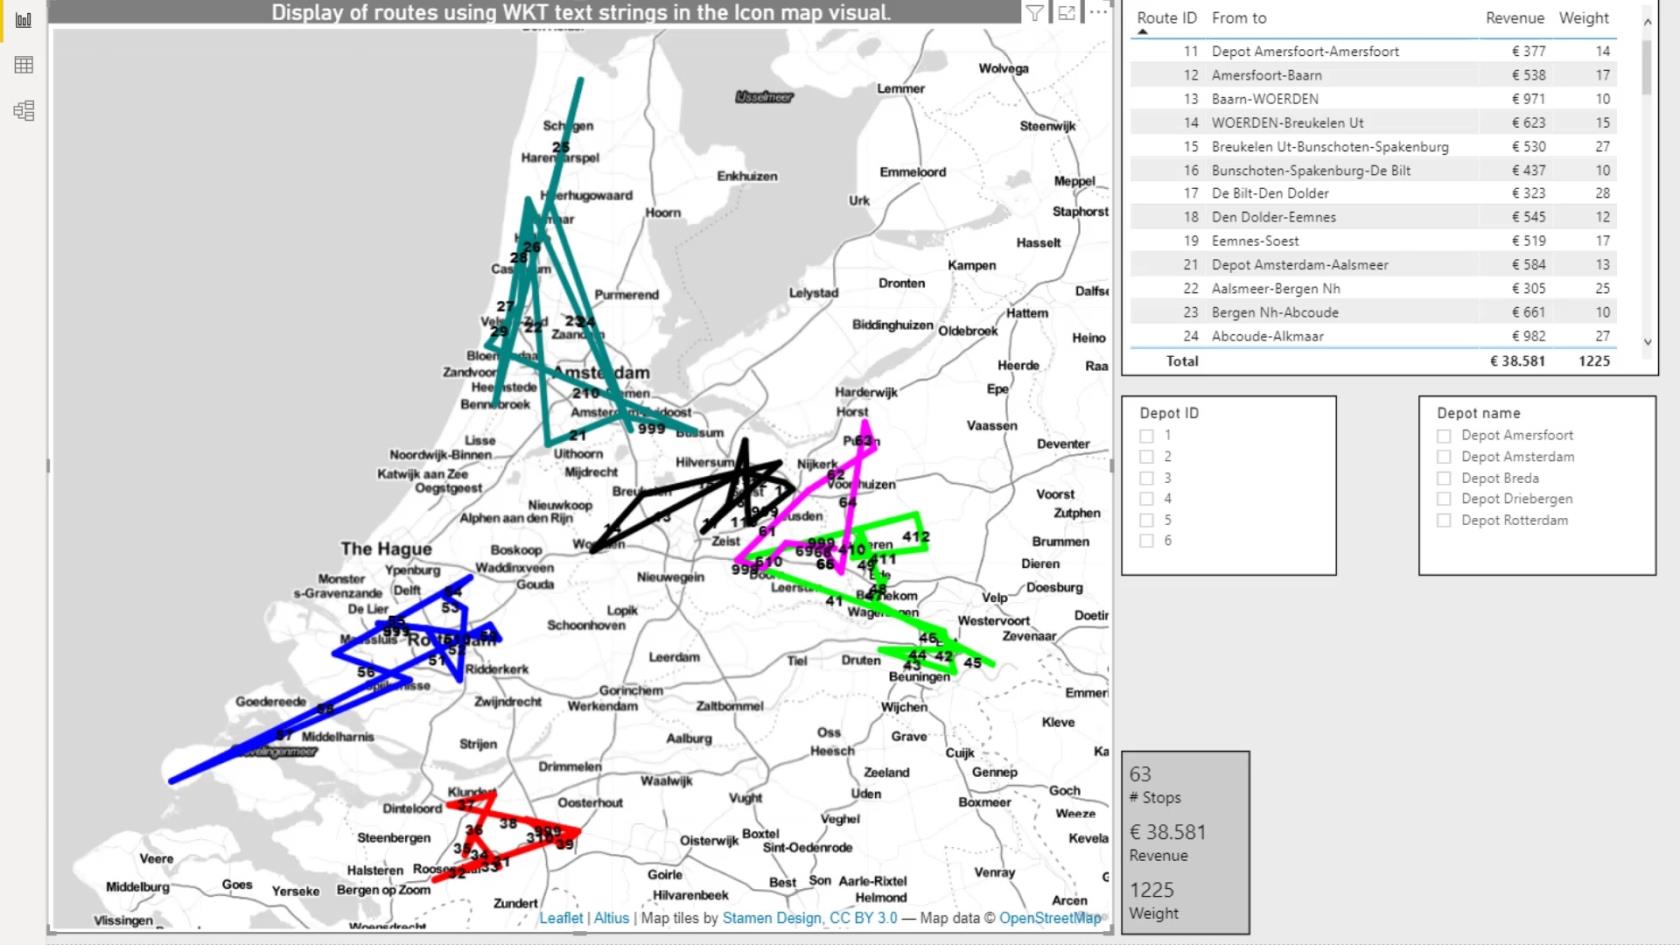
The Icon Map visual now shows the routes. It also added the relevant data into the fields row. The settings in the Formatting pane are similar to the settings in the first example which shows the gas stations.
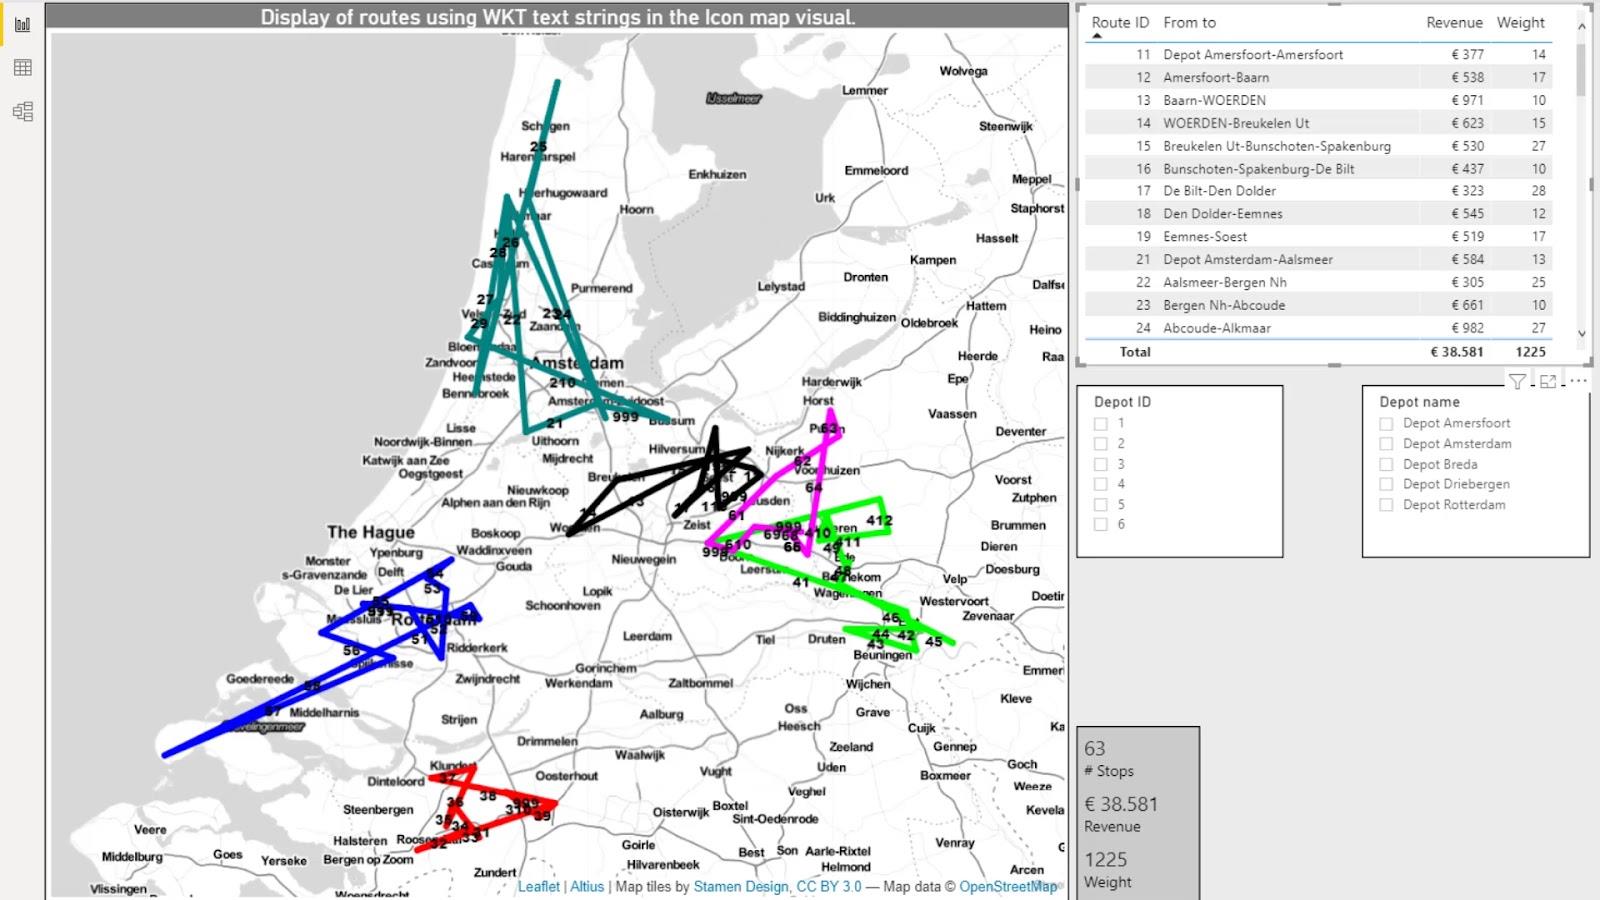
I added a few measures to calculate the number of Stops in the routes, the Revenue, and the Weight. These were placed in the cards.
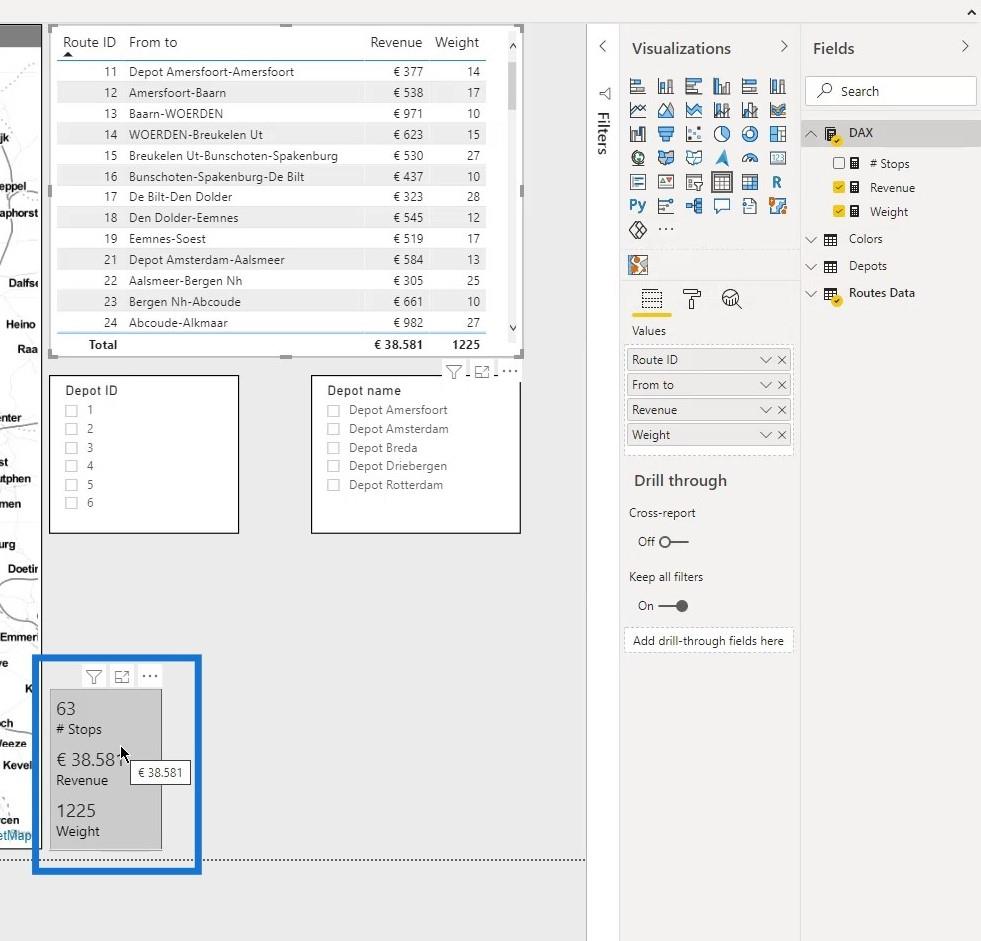
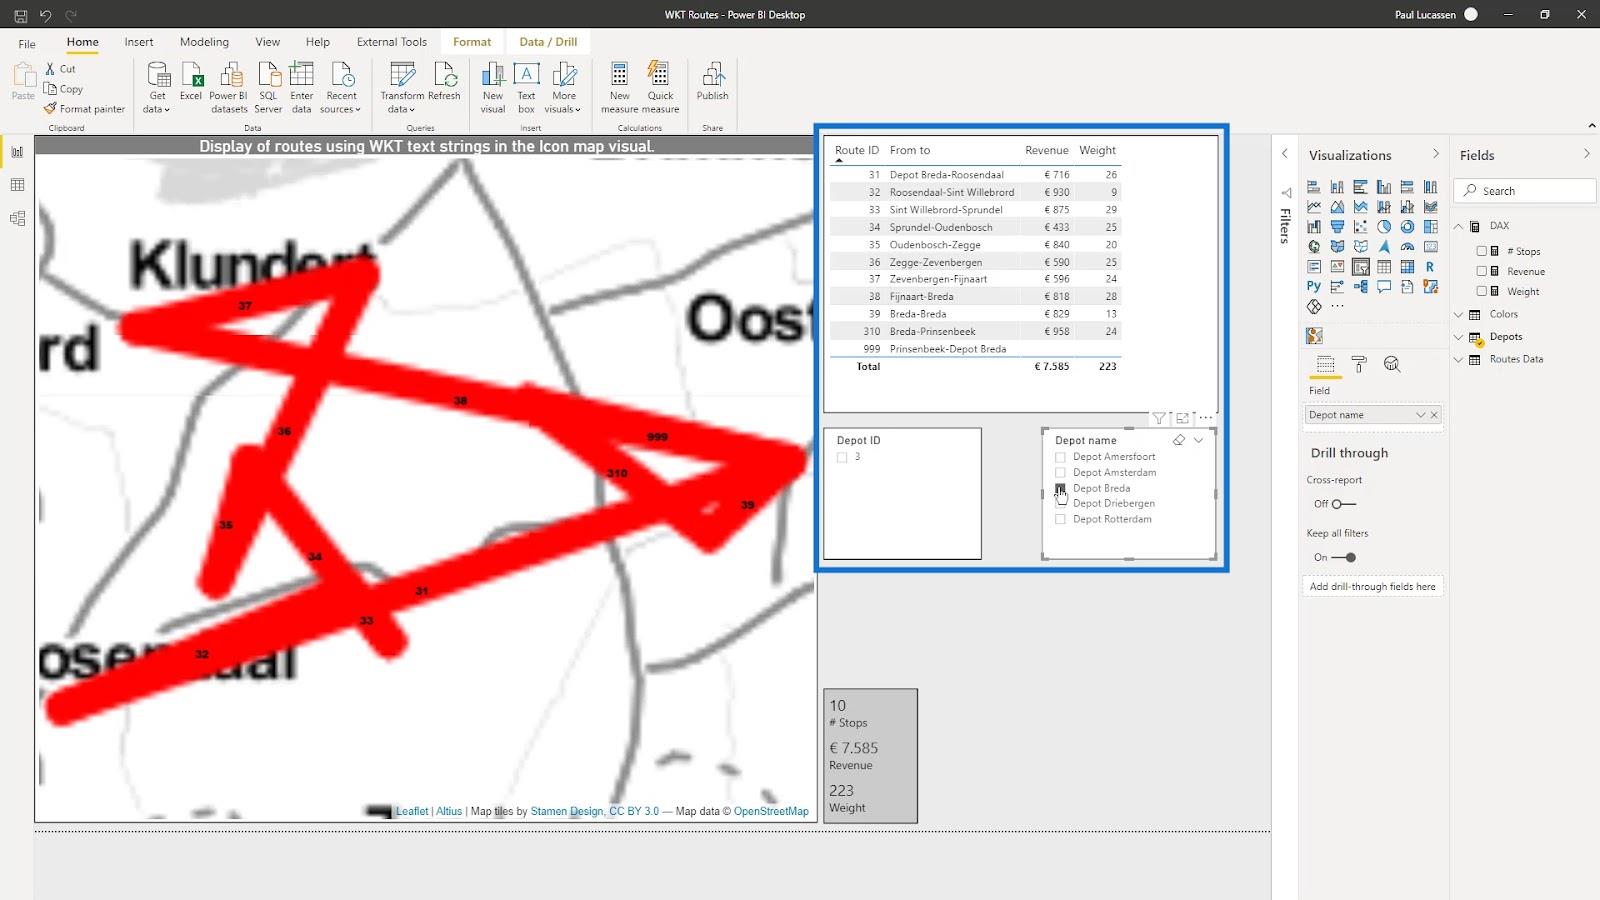
After adding a table and slicers for the Depot ID and Depot name, the basic route analysis dashboard is completed. This is now dynamic as I can make the selections that I want and the results will display accordingly.
Data Visualizations LuckyTemplates – Dynamic Maps In Tooltips
LuckyTemplates Shape Map Visualization For Spatial Analysis
Geospatial Analysis – New Course on LuckyTemplates
Conclusion
That is basically how to use well-known text strings in a LuckyTemplates icon map visual. In this tutorial, you were able to learn how to display multiple layers with WKT for flow data such as a gas grid or vehicle routes in the icon map visual.
Keep in mind that adding the relevant and required data fields are also essential to make the analysis report properly work.
Check out the links below for more examples and related content.
Cheers!
Paul
ค้นพบวิธีที่เราสามารถดาวน์โหลดและติดตั้ง R และ RStudio ซึ่งเป็นทั้งแบบฟรีและแบบโอเพ่นซอร์สสำหรับการเขียนโปรแกรมสถิติและกราฟิก
วิธีลดขนาดไฟล์ Excel – 6 วิธีที่มีประสิทธิภาพ
Power Automate คืออะไร? - สุดยอดคู่มือที่ช่วยให้คุณเข้าใจและใช้ได้อย่างมีประสิทธิภาพ
วิธีใช้ Power Query ใน Excel: คำแนะนำทั้งหมดเพื่อทำให้ข้อมูลของคุณมีประสิทธิภาพมากขึ้น
ตนเองคืออะไรใน Python: ตัวอย่างในโลกแห่งความเป็นจริง
คุณจะได้เรียนรู้วิธีการบันทึกและโหลดวัตถุจากไฟล์ .rds ใน R บล็อกนี้จะครอบคลุมถึงวิธีการนำเข้าวัตถุจาก R ไปยัง LuckyTemplates
ในบทช่วยสอนภาษาการเข้ารหัส DAX นี้ เรียนรู้วิธีใช้ฟังก์ชัน GENERATE และวิธีเปลี่ยนชื่อหน่วยวัดแบบไดนามิก
บทช่วยสอนนี้จะครอบคลุมถึงวิธีการใช้เทคนิค Multi Threaded Dynamic Visuals เพื่อสร้างข้อมูลเชิงลึกจากการแสดงข้อมูลแบบไดนามิกในรายงานของคุณ
ในบทความนี้ ฉันจะเรียกใช้ผ่านบริบทตัวกรอง บริบทตัวกรองเป็นหนึ่งในหัวข้อหลักที่ผู้ใช้ LuckyTemplates ควรเรียนรู้ในขั้นต้น
ฉันต้องการแสดงให้เห็นว่าบริการออนไลน์ของ LuckyTemplates Apps สามารถช่วยในการจัดการรายงานและข้อมูลเชิงลึกต่างๆ ที่สร้างจากแหล่งข้อมูลต่างๆ ได้อย่างไร


