Home
» Tips
»
Free Project Status Report Presentation Template for Agile Teams
Free Project Status Report Presentation Template for Agile Teams
A useful Agile project status report should let a stakeholder answer four questions quickly: Are we moving toward the product goal? What usable value has been delivered? What is putting the next outcome at risk? What decision or help is needed now? If a presentation cannot answer those questions in a few minutes, adding more charts usually makes it longer rather than better.
For most Agile teams, a seven-slide status deck is enough: status at a glance, goal and outcomes, progress, risks and impediments, scope and change, quality/release readiness, and next actions or decisions. The template below is intentionally compact. It is meant to improve transparency for stakeholders, not replace the Sprint Review, Daily Scrum, product backlog, or other working artifacts.
As of September 11, 2026, the current official Scrum Guide remains the November 2020 edition. It emphasizes transparency, frequent inspection of progress toward agreed goals, and adaptation when results or conditions change. It also says the Sprint Review is a working session in which the Scrum Team and stakeholders inspect outcomes and determine what to do next—not merely a presentation. See the official Scrum Guide.
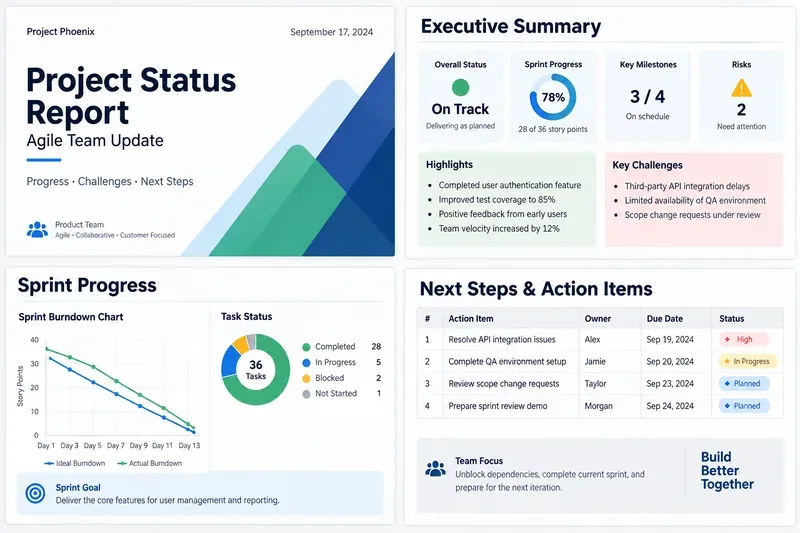
A sample Agile status-report layout showing executive status, sprint progress, challenges, and next actions in a compact presentation.
What a high-quality status deck should achieve
The deck is successful when people leave with a shared view of reality and a small number of clear actions. It is not successful merely because every slide is filled.
Quality test
Good sign
Warning sign
Goal clarity
The Sprint Goal or product outcome is stated in plain language
The deck lists tasks but never explains why the work matters
Outcome visibility
Delivered, usable results are visible
Progress is represented only by hours, tickets, or activity counts
Risk transparency
Important risks have owners, impact, and next actions
Everything is green despite known blockers
Forecast honesty
Forecasts show assumptions and uncertainty
Percent-complete numbers are presented as certainty
Decision usefulness
Stakeholders know what needs a decision or escalation
The meeting ends with “FYI” and no action
Traceability
Metrics can be traced to current team data
Numbers are copied manually with no source or date
This aligns with the Agile Manifesto principle that working software is the primary measure of progress. For teams producing something other than software, use the same underlying idea: emphasize a usable, verifiable increment or outcome rather than activity alone. See the Principles behind the Agile Manifesto.
Free Agile project status report template: 7-slide structure
Slide 1: Project status at a glance
Start with the information a busy stakeholder needs before anything else:
Product or project name
Reporting period or Sprint number
Product Goal or major objective
Sprint Goal
Overall status with a short explanation
Top one to three risks
One sentence on what changed since the previous report
If you use red/amber/green status, define the meaning. “Amber” might mean the Sprint Goal is still achievable but a dependency could materially affect timing. A color without criteria becomes subjective and can encourage status optimism.
Quality check: a stakeholder who reads only this slide should understand the current direction and the most important concern.
Slide 2: Goal, customer outcome, and delivered value
Show what the team is trying to achieve and what changed for users, customers, or the business. This slide is more valuable than a long “completed tasks” list.
A simple structure is:
Goal
Evidence of progress
What remains
Reduce checkout failures
New validation flow released to test environment; error-path tests pass
Production rollout and monitoring
Improve onboarding completion
New guided setup increment demonstrated
Accessibility fixes and final analytics validation
In Scrum, an Increment must be usable and must meet the Definition of Done before it is considered part of the Increment. That is a better anchor for status than counting partially completed backlog items as though they delivered equal value. The Scrum Guide defines the Definition of Done as the formal description of the state of the Increment when it meets the product's required quality measures.
Quality check: distinguish clearly between “done,” “in progress,” and “planned.” Do not describe work as delivered if it has not met the team's Definition of Done.
Slide 3: Sprint progress and forecast
Use one or two progress visuals only if they help a decision. The Scrum Guide recognizes practices such as burn-downs, burn-ups, and cumulative flow as useful forecasting techniques, while explicitly noting that they do not replace empiricism.
Useful choices include:
Burn-up chart: helpful when scope changes and you want to show completed work against total scope.
Burn-down chart: helpful for visualizing remaining work inside a bounded Sprint or release forecast.
Cumulative flow: helpful when you need to expose growing work-in-progress or a workflow bottleneck.
Simple outcome table: often better than a chart for small teams or executive audiences.
Avoid adding velocity merely because Agile presentations are expected to contain a chart. The Scrum Guide does not define velocity as a required Scrum metric. If your team uses it for forecasting, explain what the number represents and compare it with the team's own history rather than treating it as a universal productivity score.
Quality check: the chart should answer a question. If removing it would not change anyone's understanding or decision, remove it.
Slide 4: Risks, impediments, and dependencies
This is often the most decision-relevant slide. Separate three concepts:
Risk: a future event or condition that may create a problem.
Impediment: something currently obstructing progress.
Dependency: work, information, or capability needed from another team, vendor, system, or decision-maker.
Use columns such as:
Item
Impact
Owner
Next action
Needed by
Payment vendor sandbox instability
Could delay end-to-end testing
Integration lead
Escalate with vendor; prepare mock fallback
Sep. 22
Security review capacity
Release approval may move
Product owner
Confirm reviewer allocation
Sep. 20
Scrum explicitly values openness about work and challenges, and the Scrum Master is accountable for helping remove impediments to the team's progress. A status deck that hides uncomfortable risks works against the transparency needed for useful inspection.
Quality check: every material blocker should have an owner or an explicit escalation request. “Team is monitoring” is rarely enough for a critical dependency.
Slide 5: Scope changes and what the team learned
Agile status reporting should not imply that the original plan is sacred. The Scrum Guide says scope may be clarified and renegotiated with the Product Owner as more is learned, as long as the Sprint Goal is not endangered.
Show changes that materially affect stakeholder expectations:
New requirement discovered
Backlog item removed because it no longer contributes enough value
Technical assumption disproved
Dependency changed
Customer feedback caused reprioritization
Use a short “Changed / Why / Impact” table. This makes adaptation visible without forcing the audience to compare two backlog snapshots manually.
Quality check: explain whether a change affects the goal, forecast, cost, quality, or only the implementation approach.
Slide 6: Quality and release readiness
“On schedule” is not enough if quality is deteriorating. Include a few quality signals that matter for the product. Depending on the team, that might include:
Definition of Done compliance
Critical defects open
Automated test health
Security or accessibility checks
Production incident trend
Release blockers
Operational readiness
Do not fill the slide with every engineering metric available. Select evidence tied to whether the Increment is usable and whether stakeholders can reasonably trust the release decision.
Quality check: if the deck says “green” while a release-blocking defect remains unresolved, the status model needs to change.
Slide 7: Decisions, next steps, and owners
End with action, not a generic “Thank you” slide. A simple table works:
Action or decision
Owner
Due date
Status
Confirm API vendor fallback approach
Product Owner
Sep. 19
Decision needed
Resolve test environment capacity
Platform lead
Sep. 20
In progress
Prepare Sprint Review demo
Team
Sep. 23
Planned
Quality check: after the presentation, there should be no ambiguity about who owns the next externally visible action.
Which metrics belong in an Agile status presentation?
Use metrics only when they support inspection and adaptation. A practical selection framework is:
Do not turn the deck into a scorecard of vanity metrics. Story points completed, number of tickets closed, or utilization can all be valid internal signals in a particular context, but they are not substitutes for usable outcomes. The Agile Manifesto's emphasis on working software as the primary measure of progress is a useful guardrail here.
When a presentation is the wrong tool
A deck is useful when the audience needs a concise, periodic synthesis. Change the approach when:
Stakeholders need real-time operational data; use a live dashboard.
The team needs to coordinate today's work; use the Daily Scrum and current Sprint Backlog.
The audience needs to inspect the actual Increment; demonstrate it rather than describing it on slides.
The team is discussing why its process failed; use the Sprint Retrospective.
Detailed backlog ordering is needed; work directly in the backlog or product-management system.
The Scrum Guide is especially clear that the Sprint Review should not be limited to a presentation. A project status deck can prepare stakeholders and summarize context, but it should not replace collaborative inspection of the product and discussion of what to do next.
How often should you update the deck?
Match the reporting cadence to the decisions the audience needs to make. Many teams update status once per Sprint, while programs with significant dependencies may need a shorter weekly summary. More frequent reporting is not automatically more transparent if the deck simply repeats yesterday's data.
A useful rule is: update when the information can change a stakeholder decision, forecast, or risk response. Keep the source date visible on every metric that is not live.
Design rules that improve readability
PowerPoint supports starting from a prepared template as well as a blank presentation, and Microsoft recommends templates when you want a consistent arrangement of layout, fonts, colors, and effects. See Microsoft's PowerPoint presentation guidance.
For a status deck:
Use one message per slide.
Prefer short tables and direct labels over dense paragraphs.
Show the reporting period and data date.
Keep status colors consistent and define them.
Use large text that remains readable in a meeting room.
Do not rely on color alone to communicate risk; add text or icons.
Link to the source system when deeper detail is useful.
If you want to reuse the deck, Microsoft also supports saving a customized presentation as a PowerPoint template (.potx) so the same structure can be used for future reports. See Microsoft's template creation guidance.
How to know when the template needs to change
Do not keep the same slides forever simply because the deck is branded. Change the template when its information no longer supports the decisions being made.
Signals include:
Stakeholders repeatedly ask for the same missing information.
Slides are copied forward unchanged for several Sprints.
Teams spend more time formatting than discussing risk or outcomes.
Metrics encourage unhelpful behavior, such as optimizing ticket count rather than value.
Risk items stay red with no owner or action.
The deck duplicates a live dashboard without adding interpretation.
The meeting becomes a one-way presentation rather than inspection and adaptation.
A useful template should reduce reporting effort over time, not create a second project-management system that must be maintained by hand.
Limits of this free status-report template
This structure works well for a small Agile team, a single product stream, or an executive summary of a larger initiative. It is less suitable when a program contains many products, regulated stage gates, contractual earned-value reporting, complex portfolio finance, or dozens of cross-team dependencies. In those cases, the seven-slide deck can remain the executive summary, but detailed governance should live in the appropriate source systems and program controls.
It also does not prescribe a universal set of Agile metrics. Scrum is intentionally lightweight, and the Scrum Guide notes that techniques and tactics can vary widely by context. Choose the smallest set of evidence that makes the actual state of the work visible enough for good decisions.
Final quality checklist
The Product Goal and Sprint Goal are visible.
Delivered value is separated from work still in progress.
Status is supported by evidence, not color alone.
Forecast charts have a clear purpose.
Risks, impediments, and dependencies are distinguished.
Material changes in scope or assumptions are explained.
Quality and release-readiness evidence is included when relevant.
Every requested decision or escalation has an owner and date.
The deck is concise enough to discuss rather than read aloud.
The presentation complements—rather than replaces—the team's Scrum events and live artifacts.
A strong Agile project status presentation is ultimately a decision aid. It makes the team's current reality visible, connects progress to goals and usable outcomes, exposes risk early enough to act, and ends with clear next steps. If the deck does that with five slides instead of seven, use five. If a live dashboard makes one slide redundant, remove it. The template should serve transparency and adaptation—not become another ceremony the team has to feed.